Environmental Management of Road Projects
This year we screened 426 projects for potential environmental impacts and determined that 222 of these required further investigations through our Environmental Impact Assessment process. One project was referred to the EPA for potential assessment under state legislation, Section 38 of the Environmental Protection Act 1986 (WA), as the impacts were related to the clearing of native vegetation and were managed under a Clearing Permit. We applied for 15 Clearing Permits and 13 were granted. Two are still under assessment. Four Clearing Permits were appealed in 2017.
We used our State Wide Clearing Permit CPS818/12 to clear native vegetation in the delivery of 70 projects in 2017. 10 projects were referred to the Department of the Environment and Energy for potential assessment under the Commonwealth’s Environmental Protection and Biodiversity Conservation Act 1999 and four of these projects were assessed.
The following table summarises the number and assessment level of our projects over the past three years.
| Number of road projects subjected to environmental screening |
357 |
298 |
426 |
| Number of road projects for which environmental impact assessment was conducted |
235 |
160 |
222 |
| Number of road projects referred for possible assessment under state legislation, Section 38 of Environmental Protection Act 1986 (EP Act, s. 38) |
0 |
1 |
1 |
| Number of road projects assessed under state EP Act, s. 38 |
2 |
1 |
1 |
| Number of project specific Clearing Permit applications (includes amendments to existing permits) |
18** |
16** |
15 |
| Number of project specific Clearing Permits granted (includes amendments to existing permits) |
12*** |
22*** |
13 |
| Number of project specific Clearing Permits appealed |
* |
* |
4 |
| Number of road projects that cleared native vegetation using Main Roads state-wide clearing permit CPS 818/12 |
70 |
68 |
70 |
| Number of road projects referred for possible assessment under Commonwealth legislation, Environmental Protection and Biodiversity Conservation Act, 1999 (EPBC Act) |
14 |
11 |
10 |
| Number of road projects assessed under Commonwealth EPBC Act |
4 |
3 |
4 |
Clearing, Revegetation and Offsets
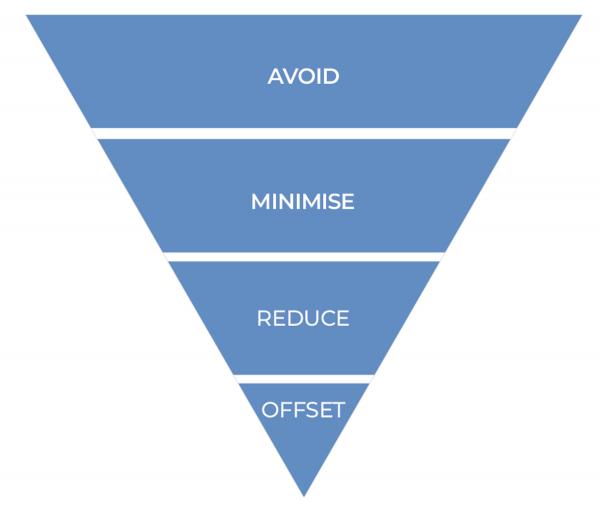
We strive to find a balance between achieving road safety objectives and the environment and it is not always possible to avoid the clearing of native vegetation. We reduce our clearing footprint where possible by changing the project scope and design, restricting earthworks limits for projects, steepening batters, installing barriers, establishing borrow pits in cleared paddocks and avoiding temporary clearing for storage, stockpiles and turn around bays. Where avoidance is not possible, and after seeking to minimise and reduce our impacts, we then seek to offset our impacts.
In 2017 we cleared 246 hectares of native vegetation for the delivery of 92 projects. To mitigate the negative impacts of this clearing we provided offsets in the form of 83 hectares of revegetation and the provision of $1,978,567 to the Western Australian Offset Fund for the purchase and management of 1,739 hectares of native vegetation. We revegetated, which was not a regulatory requirement, a further 123 hectares using native species to achieve a positive environmental outcome. Further information regarding approved project offsets can be viewed via the Department of the Environment and Energy website or the Government of Western Australia Environmental Offsets Register.
The table below summarises our clearing, revegetation and offset activities over the past three years.
| Clearing (ha) |
|
424 |
487 |
246 |
| Total revegetation (ha) |
|
176 |
287 |
206 |
| Offset |
|
|
|
|
| Revegetation (ha) |
(a) |
67 |
3 |
83 |
| Land acquisition (ha) |
(b) |
None settled |
3,285 |
None settled |
| (Value of land acquired ($)) |
|
|
(16,642,883) |
|
| Financial contribution ($) |
|
971,848 |
3,077,979 |
1,978,567 |
| (Area of land to be acquired using the financial contribution (ha)) |
(c) |
(216) |
(691) |
(1,738) |
| Total offset (ha) |
(a + b + c) |
283 |
3,979 |
1822 |
Management of Aboriginal Heritage Sites in Road Projects
This year we screened 482 projects for potential impacts to Aboriginal Heritage Sites and determined that 54 of these required further assessment. The impacts to Aboriginal Heritage sites was considered unavoidable for 23 projects. We applied for and were granted approval for these impacts under Section 18 of the Aboriginal Heritage Act, 1972 (WA).
|
Aboriginal Heritage Risk Assessments
|
388 |
451 |
482 |
|
Further Impact Assessment (Archaeology / Ethnography / Anthropology)
|
** |
42 |
54 |
|
Section 18 Applications Granted*
|
12 |
18 |
23 |
Management of Environmental Incidents
All of our regions and operational areas prepare for the possibility of significant environmental incidents by ensuring there are systems and processes in place for valid contingency planning and incident response. Our environmental incident reporting and investigation process reflects the risk classification adopted across the Transport Portfolio agencies, with five categories of incidents – catastrophic, major, moderate, minor and insignificant.
The environmental incident reporting and investigation process applies to Main Roads as well as to Third Parties, that is, an organisation or a person not employed by or working on behalf of Main Roads. Significant Third Party and Main Roads Environmental Incidents that occurred last year are outlined below.
|
Incidents caused by Third Parties
|
7 |
4 |
3 |
|
Incidents caused by Main Roads or people working on Main Roads behalf
|
6 |
11 |
19 |
We have noticed an increasing trend in the total number of significant incidents reported since 2015 reflecting a culture we have encouraged and cultivated over the years. We are pleased that our regions and operational areas are embracing the opportunity to identify issues on the network and to seek continual improvement of our environmental performance.
In 2017 there were no incidents classified as catastrophic, one incident classified as major and 18 classified as moderate. The major incident related to unauthorised clearing of native vegetation, conducted for a temporary side track adjacent to the construction area.
Works were stopped immediately and Department of Water and Environmental Regulation (DWER) was notified for investigation and potential prosecution relating to the incident. The 18 moderate incidents related to spills, unauthorised clearing, working outside of normal hours without an approval and failure to comply with the timeframe of Department of the Environment and Energy approval conditions.
These incidents didn’t incur any penalties or financial sanctions and we addressed these procedural failures through training, changes in processes and increased compliance audits to ensure they are not repeated. In 2017 there were no third party incidents classified as catastrophic or major. Three incidents were classified as moderate and related to unauthorised clearing of native vegetation on Main Roads managed land and were reported to DWER.
Sustainability Assessment in Projects and Operations
We have adopted the Infrastructure Sustainability (IS) rating tool for our highest value major projects, Australia’s only comprehensive rating system for evaluating sustainability across design, construction and operation of infrastructure. All infrastructure projects exceeding $20 million utilise the IS framework as part of project development and evaluation. Three programs and one individual project have been registered for an IS Rating. Two projects achieved a Design Rating. The Northlink Southern Section was verified as a Leading rating and won the IS Outstanding Achievement Award and the IS Impact Award for a project greater than $20 million in value at the Infrastructure Sustainability Council of Australia awards.
Stand-alone public sustainability reports are produced for our projects with IS obligations. This year Great Northern Highway Muchea to Wubin Stage 2 Upgrade, NorthLink WA – Southern Section: Guildford Road to Reid Highway and NorthLink WA – Central Section: Reid Highway to Ellenbrook, Network WA Northern Section: Ellenbrook to Muchea and the Metropolitan Roads Improvement Alliance have submitted a public Sustainability report. For more information on IS and to view the project Sustainability reports please go to our website.
The following table lists all projects greater than $100 million that have been formally registered for an IS rating and their current status.
| Great Northern Highway Muchea to Wubin Stage 2 Upgrade |
Overall Program |
Design |
Commended |
Excellent |
| Muchea North |
As Built |
Commended |
Not Started |
| New Norcia Bypass |
As Built |
Commended |
Commended |
| Walebing |
As Built |
Commended |
Not Started |
| Miling Bypass |
As Built |
Commended |
Commended |
| Miling Straight |
As Built |
Commended |
Commended |
| Pithara |
As Built |
Commended |
Not Started |
| Dalwallinu to Wubin |
As Built |
Commended |
Not Started |
| NorthLink WA |
NorthLink WA Southern Section |
As Built |
Excellent |
Verified Leading for Design |
| Northlink WA Central Section |
Design |
Excellent |
Leading |
| Northlink WA Northern Section |
Design |
Excellent |
Excellent |
| Mitchell Freeway |
Mitchell Freeway Extension |
As Built |
Commended |
Verified Commended Design
Commended
|
| Metropolitan Roads Improvement Alliance |
Armadale Road |
Design |
Excellent |
Excellent |
| Murdoch Activity Centre |
Design |
Excellent |
Excellent |
| Wanneroo Road Duplication |
Design |
Excellent |
Excellent |
The following table provides information on projects valued between $20 and $100 million and subject to internal self-assessment using the IS rating tool and current status.
| Swan River Pedestrian Bridge – Matagarup Bridge |
As Built |
Commended |
Excellent |
| New Lord Street |
Design |
Commended |
Commended |
| Nicholson Road Bridge Over Rail |
Design |
Commended |
Commended |
| Old Mandurah Traffic Bridge |
Complete |
Commended |
Commended |
| Great Northern Highway – Wyndam Spur/Maggies Jump up |
Design |
Commended |
Excellent |
| SMART Freeways |
Design |
TBD |
Not Started |
Emissions and Energy
The development, operation and use of a road network consumes energy and generates emissions in numerous forms. The predominant impacts from energy and emissions fall outside our direct control and arise from use of the road network itself. Road transport makes up 15 per cent of Australia’s total emissions and has been the highest growing source of emissions since 1990. We estimate that the road network generates carbon emissions at a rate of 295.6 t CO2-e per million vehicle kilometres travelled (MKVT). In 2017-18 MKVT was 29,609 and thus emissions were approximately 8.7 mt CO2-e from use of the road network. Our current approach has focused on reducing our direct energy use and emissions generation but we are aware of our ability to influence outcomes from our contracts and from the road network use. For example, travels times have been improved in locations across the network including by up to two minutes on Leach Highway and Ennis Avenue. Less delay and stop-start traffic has a positive effect on carbon emissions from the road network.
Carbon Reduction Plan
We have a Carbon Reduction Plan and Target, 5 to 15 per cent reduction on 2010 levels by 2020, focused on Scope One and Two emissions and have had a Climate Change Adaptation Plan since 2011. Our total emissions across our facilities over the past year were 25,886 CO2-e, achieving our target which was to be below 29,597 CO2-e.
In December 2017, the State Government signed a Memorandum of Understanding (MOU) for Sub-National Collaboration on Electric Vehicles (EVs). The MOU is an output of the Climate Action Roundtable. Broadly speaking it aligns with Main Roads’ Sustainability Policy and could be leveraged to drive positive outcomes for the key aspects of Sustainable Transport and Environmental Footprint specifically energy efficiency, greenhouse gas emissions, air quality and noise. Since the meeting a draft Terms of Reference has been developed by Department of Water and Environmental Regulation and circulated. As a result, we were nominated joint lead to ‘Take a coordinated approach to the strategic planning and construction of infrastructure for EVs’.
Energy Usage and Greenhouse Gas
| GHG Type (t CO2) |
2016 |
2017 |
2018 |
| Fuel* |
2,833 |
2,860 |
3,088 |
| Street and traffic lights |
18,759 |
16,804 |
18,614 |
| Buildings |
4,978 |
4,230 |
4,183 |
| Air travel* |
263 |
271 |
331 |
| Projects and maintenance fuel use |
8,405 |
8,010 |
27,661 |
| Offsets |
-2,879 |
-1,183 |
0 |
| Total |
32,359 |
44,472 |
53,877 |
| GHG Category (t CO2) |
2016 |
2017 |
2018 |
| Scope 1 |
3,000 |
3,046 |
3,296 |
| Scope 2 |
23,571 |
20,848 |
22,590 |
| Sub Total |
26,571 |
23,848 |
25,886 |
| Scope 3* |
11,073 |
11,381 |
27,991 |
| Offsets |
-2,879 |
-1,183 |
0 |
| Total |
23,692 |
22,711 |
25,886 |
| |
2016 |
2017 |
2018 |
| MJ per km State Road |
8493 |
8101 |
8850 |
Scope 1 & 2 t CO2 per
km State Road |
1.44 |
1.29 |
1.40 |
| Energy Source |
2016 |
2017 |
2018 |
| Electricity Usage (MJ) (within) |
112,676,588 |
105,404,169 |
116,622,673 |
| Fuel and Gas Usage (MJ) (within) |
44,555,099 |
45,095,868 |
47,353,145 |
| Projects and maintenance (outside) |
119,369,318 |
290,651,418 |
374,828,266 |
Climate Change Adaptation
We have identified more than 50 kilometres of State Roads that have been assessed to warrant earlier, more detailed evaluation for the impacts of climate change. The indicative replacement value of this at-risk infrastructure is in the order of $165 million. A fundamental aspect of our Sustainability Policy is climate change. Our Key Aspect Management Plan for Climate Change includes a progressive approach to embedding adaptation practice into standards and asset management practices. An important activity was embedding resilience into our asset management framework.
Materials for Road Building
Natural materials are crucial in road building. Our philosophy on materials use is to minimise lifecycle impacts, including embodied energy, and follow the hierarchy of reduce, re-use where possible, and recycle materials to their highest end use possible. When obtaining road-building materials, we endeavour to avoid clearing natural vegetation. On-site materials unsuitable for use in road construction are used, as appropriate, for rehabilitating areas where road-building materials were obtained.
Crush Recycled Concrete (CRC) is a road building material which is under utilised in Western Australia at this point in time. We recognise our role in establishing on going practice for this use of this material. A key project during 2017-18 was the development of a forward program of major projects which is aiming to utilise up to 100,000 tonnes of CRC from projects commencing in 2018-19. We have worked extensively with the Department of Water and Environmental Regulation and industry stakeholders, including the Waste and Recycling Industry Association of WA in developing this forward program.
Imported Road Construction Materials
| Sand (t) |
354.0 |
768.7 |
5,722.9 |
| Gravel (t) |
1,506.8 |
1,244.4 |
1236.7 |
| Crushed rock (t) |
409.5 |
404.3 |
684.5 |
| Limestone (t) |
142.0 |
462.2 |
814.4 |
| Aggregate (t) |
72.9 |
83.8 |
172.6 |
| Asphalt (t) |
5,750.2 |
1,199.0 |
2700.6 |
| Other (t) |
915.3 |
1.8 |
66.0 |
| Concrete and steel (t) kerbing, barriers, bridges and concrete culverts |
1,064.8 |
244.9 |
152.2 |
| Other (t) |
7.4 |
0.8 |
1.5 |
Waste Materials to Landfill (Waste)
| Kerbing (m) |
1,097 |
8,947 |
474 |
Pavement/footpath
(m2) |
2,426 |
442 |
6 |
| Existing seal (m2) |
3,464 |
212 |
12,474 |
| Unsuitable material (m3) |
15,808 |
3,607 |
27,877 |
| Other (m3) |
3,675 |
2,559 |
703 |
Materials Recycled
| Rehabilitation purposes (t) – unsuitable material |
8.7 |
4.3 |
7.0 |
| Sand (t) |
19.24 |
5.4 |
73.7 |
| Road base (t) |
6.4 |
0.0 |
37.4 |
| Asphalt/Profiling (t) |
23.0 |
12.2 |
26.8 |
| Steel (t) |
0.2 |
0.9 |
5.6 |
| Concrete (t) |
0.3 |
6.7 |
0.3 |
| Office waste (t) |
1.6 |
3.2 |
1.6 |
| Other (t) |
96.97 |
0.0 |
17.8 |
| Total (t) |
156.5 |
32.7 |
165.4 |
Waste Management: Roadsides, Buildings and Facilities
Roadside waste across the entire state road network requires ever-increasing attention to control. We are collaborating with key stakeholders, interested parties and community groups to implement a consistent litter management approach for the state whilst taking into account individual regional requirements. We continue to implement our State Wide Litter Plan which has been developed with the primary objectives to educate road users to take their litter with them and reduce the occurrence of litter and illegal dumping. This has been done through greater public awareness, increased community buy-in and participation in litter reduction programs and behaviours.
Our commitment to improved waste management practices is evident in the design, construction, operation and ongoing management of our offices and depots, incorporating waste management principals in the design and construction to achieve 5-star Green Star and NABERS ratings. We also have a suite of waste avoidance strategies across our offices and waste management plans for our depots that include a variety of materials, such as asbestos, concrete, steel, aluminium, batteries and waste oil. The separation of general office waste and recyclables is encouraged by providing paper, battery and printer cartridge recycling facilities.


