

Key Achievements
Customer Profiling and Segmentation
There are more cars on the road than ever before and in the face of increased pressure on our network we need to make sure road users are kept informed about their journey in instant, accurate, easy-to-understand and accessible ways.
To deliver this service we need to understand our customers and adapt to improve the way those requirements are met. Customer profiling and segmentation is one way that will assist us to achieve this and last year we commenced research aimed at developing a comprehensive road user profile.
This was our first step towards full customer profiling and segmentation. We analysed, demographics, traits, values and lifestyles to better understand how customers interact with our network, their transport choices and their behaviour. The road user profiles identified from this research will assist in the development of initiatives specific to the needs of differing road users.
CONNECT – a Customer Relationship Management System
CONNECT is a new system that align and streamline business processes between our customer operations and other business areas. By integrating with other corporate systems it will provide a more holistic view of issues that our customers are experiencing, and guide our response to faults on the network. The first phase of the system is focussed on improving our fault reporting processes with the teams who respond to and fix hazards and faults on our network.
Community Perception Survey
The Community Perception Survey (CPS) has been conducted annually since 1994 to track our performance on a range of issues such as road safety, cycling and pedestrian facilities and maintenance of the road network. This year we conducted the survey in April, the following are the headline results:
| Satisfaction with: | 2012 | 2013 | 2014 |
| Our overall performance | 95% | 94% | 94% |
| Road Safety | 92% | 94% | 95% |
| Provision of cycle ways & pedestrian facilities | 76% | 83% | 90% |
| Road maintenance | 90% | 84% | 93% |
The survey identified that key priority areas for:
- Metropolitan road users are traffic congestion, fixing hazards and faults quickly, constructing new roads and providing extra lanes to existing roads
- Regional road users are safety resulting in a greater demand for safer road edges and more space and opportunity for overtaking.
User Satisfaction Index
The Austroads USI is a single number rating out of five that indicates the extent to which road users are satisfied with the wider road network in Australia and New Zealand.
Measured every three years the Austroads USI looks at the wider road network system including local roads and elements that contribute to its efficiency such as the public transport system.
This year, we coordinated the Survey which saw WA identified as one of the strongest performing member agencies, ranking 2nd highest overall on the Overall Performance KPI and 1st overall in terms of Member Agency Performance. The table below shows how we’ve performed in the past three surveys against the other States and Territories.
| Year | ACT | NSW | NT | NZ |
| 2007 | 3.74 | 2.96 | 3.60 | 3.33 |
| 2010 | 3.66 | 2.89 | 3.44 | 3.48 |
| 2013 | 3.91 | 3.34 | 3.86 | 3.67 |
| Year | QLD | SA | TAS | VIC | WA |
| 2007 | 3.12 | 3.11 | 3.21 | 3.38 | 3.36 |
| 2010 | 3.11 | 3.18 | 3.17 | 3.33 | 3.48 |
| 2013 | 3.25 | 3.34 | 3.39 | 3.32 | 3.72 |
Customer Information
Centre Through our Customer Information Centre (CIC), we provide a 24 hour seven days a week information service to the community using a range of tools catering for diverse customer needs across the State.
The CIC plays an important role in state-wide incident management providing timely and pertinent information to the public and stakeholders. Cyclones, bushfires, storms and major incidents kept the CIC team busy this year assisting communities and road users in affected areas across the State.
In December 2013 the CIC telephony system was upgraded to provide a more streamlined service to customers. As part of the upgrade, we introduced an Interactive Voice Response (IVR) menu to expedite information gathering for callers that allows them to choose from a number of different options to direct their call more efficiently.
The numbers:
| Customer Contact Statistics | 2012 | 2013 | 2014 | Variance |
| Telephone calls | 208,140 | 150,234 | 117,105 | -33,129 |
| Email enquiries | 16,014 | 18,104 | 21,118 | +3,014 |
| Perth Twitter followers | 3,670 | 10,516 | 25,466 | +14,950 |
| WA Roads Twitter followers | 748 | 2,750 | 4,570 | +1,820 |
The introduction of a number of self service options for customers has influenced the drop in call volumes. People can now find the information they are looking for via our website, social media channels and associated online services including the Right Move Perth app and Get the Bigger Picture website.
Customer Feedback
There are a number of ways customers can provide us with feedback and these can be found on our website. All calls and emails are analysed monthly to identify why people contact us. The results of all of this analysis are used to improve information and services for customers by targeted improvements in online services, process improvements and the elimination of barriers to customer outcomes.
To ensure all employees have the appropriate skills in capturing and actioning customer feedback, a ‘customer service’ section is included for all new employees during their induction. This complements our online training in complaints handling and the deliverables in the customer service charter.
Our Business Improvement Committee meets quarterly to monitor improvements in customer outcomes as a result of targeted activities around high trending complaints and the actions taken to eliminate or reduce these complaints.
The following table displays the type of feedback we’ve received:
| Feedback Type | 2012 | 2013 | 2014 |
| Complaint | 1,783 | 2,789 | 2,912 |
| Customer Request | 336 | 456 | 1,712 |
| Compliment | 154 | 218 | 273 |
| Business Improvement | 100 | 55 | 38 |
| Total Feedback | 2,373 | 3,518 | 4,935 |
The following table displays the top five areas of complaints:
| Category of complaint | 2012 (%) | 2013 (%) | 2014 (%) |
| Traffic Signals | 12 | 10 | 19 |
| Traffic Congestion | 10 | 9 | 9 |
| Road Works | 9 | 9 | 8 |
| Safety Issues | 6 | 7 | 8 |
| Traffic Management | 6 | 7 | 5 |
For more information on our Complaints Handling Process, please refer to our Governance section on page 88.
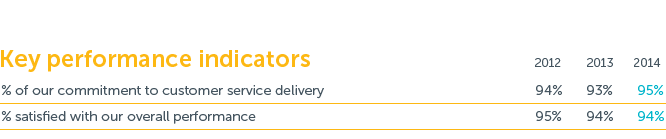
Customer Charter Index
The Customer Charter Index incorporates a range of measures across the organisation which align to deliver our commitments to customers. We report our performance against these measures quarterly on our website.
As we develop new services for customers, further measures will be added to the CCI to accurately reflect our performance against our growing commitments.
The overall result is 95.4% against a target of 100%.
Social Media
We’re constantly looking at better ways to communicate with our customers and realise that to keep in touch with the diverse travelling public we need to integrate our more traditional communication mediums with social media channels. To guide this integration we have developed a Social Media strategy that will drive the delivery of clear and consistent messages to our customers and increase public awareness of our services to improve customer engagement. Our first forays into the social media space have been successful and other channels are currently being explored.
Twitter continues to be a highly successful method of communication for the delivery of incident and traffic information on our road network. We have a following, which to our knowledge is unmatched by any other road agency in Australia.
The numbers:
- Perth_Traffic – 25,466 followers
- WA Roads – 4,570 followers
- Average Tweets per month – 860
YouTube
To help our customers gain a greater understanding and awareness of significant changes to our services and network, we now have a You Tube channel. As at the end of June 2014, there were 14 videos viewed just over 21,000 times. This is a new channel of communication that we will continue to explore.
Online Traffic
Cameras Our online traffic cameras deliver video streams from our Traffic Operations Centre to TV stations for the use in their news broadcasts. Initially there will only be 4 streams out of a selection of 6 camera feeds from our traffic camera network. This will be expanded to include all camera feeds in the Perth metropolitan area where the cameras are directly connected to our fibre network.
Customer Service Advisory
Council Established in 2006, the Customer Service Advisory Council has supported our improvement in service delivery and challenged us to extend and broaden our thinking in our operations, projects and strategic planning. The Council challenges our various business areas to improve customer outcomes.
During the year, the Council provided feedback and direction on:
- Improvements to our Stakeholder Satisfaction Survey
- The Traffic Congestion Management Program Communications
- The development of our Social Media Strategy
- Issues and communication needs surrounding the Elizabeth Quay project
The Council is independently chaired by Edd Black, Principal of Huntingdale Primary School and has community and industry members representing our diverse road users.
Advisory Groups
To ensure that our operations are open, accountable, fair and flexible, we collaborate with a wide range of customers and stakeholders who provide essential input to operational aspects of our business. The table below lists the various advisory groups that we have and frequency of our meetings with them.
| Advisory Group | Meeting Frequency per Annum |
| Customer Service Advisory Council | 4 |
| Cycling and Pedestrian Advisory Group | 3 |
| Disability Advisory Group | 12 |
| Western Australian Road Construction and Maintenance Industry Advisory Group | 4 |
| State Road Funds to Local Government Advisory Committee | 3 |
| Traffic Management for Works on Roads Advisory Group | 4 |
| Traffic Management for Events Advisory Group | 4 |
Disability Access and Inclusion Plan
Objective: Achieve the State Government’s vision for a better quality of life for all Western Australians
Main Roads Disability Access and Inclusion Plan (DAIP) was launched in 2012 for the five year period to 2016. The DAIP has been produced in recognition that people with disabilities, their families and carers have the same rights to access our services and employment opportunities as any other member of the community.
The Plan adds further emphasis to the significant progress that we have already made in addressing the needs of people with disabilities since its inception in 1995.
The DAIP provides a framework that outlines a suite of implementation strategies designed to enable us to achieve the following seven outcomes during the 5 year lifetime of the plan.
- Outcome 1: Have the same opportunity as other people to access the services of, and any events organised by Main Roads.
- Outcome 2: Have the same opportunity as other people to access the buildings and other facilities of Main Roads.
- Outcome 3: Should receive information from Main Roads in a format that will enable them to access the information as readily as other people are able to access it.
- Outcome 4: Should receive the same level and quality of service from the staff of Main Roads as other people receive.
- Outcome 5: Have the same opportunities as other people to make complaints to Main Roads.
- Outcome 6: Have the same opportunities as other people to participate in any public consultation by Main Roads.
- Outcome 7: Have the same opportunities as other people to access employment at Main Roads.
Progress on reaching these outcomes is reported to the Disability Services Commission every year in July. For further information on all the desired outcomes and progress on the DAIP visit our website.
Looking Ahead
- Work toward releasing a new and refreshed Customer Service Strategy.
- Improve the Customer Service Charter and align to the Customer Service Strategy.
- Develop a Good Neighbour Policy. ∞ Revise the traveller amenities and rest area brochure.
- Develop a Customer Communication Channel Strategy.
- Embed a variety of social media channels into regular communication.
To help road users get from point A to point B as efficiently and safely as possible, we’ve been working on a number of initiatives that inform and improve the road user experience. Read More
As congestion increases, there is a greater need for reliable and real time traveller information. Implemented in 2009, our Twitter accounts are still a channel of choice for road users to find the information they need to plan their journey.
Perth_Traffic has seen a steady increase in followers since its inception with nearly 8,500 additional followers just this year with our regional account, WA_Roads, amassing close to 5,000 followers and growing.
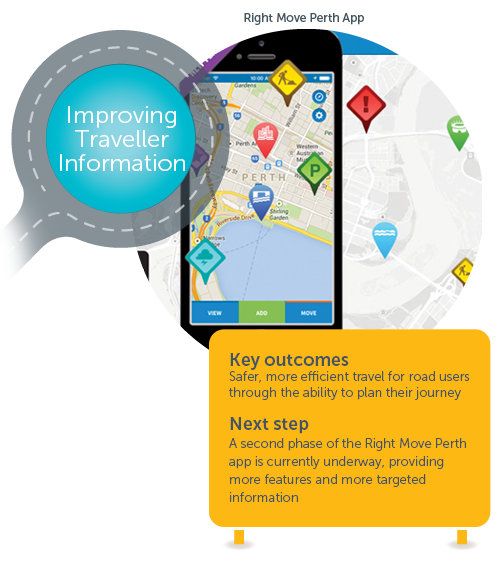
Right Move Perth
We have been working closely with other State transport agencies to develop a mobile application that provides integrated, real time traffic information to help Perth metropolitan road users plan their journey.
The Right Move Perth smartphone app provides real time information regarding congestion, roadworks, crashes, traffic signal faults, public transport disruptions, major events, project information and weather warnings.
The consistent take-up of our Twitter service and the Right Move Perth application shows, not only that the thirst for real time journey planning information is out there – but that road users are more and more turning to technology to find the information that they need.
The numbers
- Right Move Perth has had over 27,000 downloads since launching in January 2014
- Perth Traffic twitter has over 20,000 followers, the most of any State Government agency