


Our performance measures support managerial decision making by providing useful information regarding how efficient and effective our core processes are, if improvements are necessary, to identify potential risk areas, determine if our customers and stakeholders are satisfied and if we are meeting our own and the Government’s goals.
We have a well-established outcome based performance measurement framework that seeks to measure the organisation’s success in terms of delivering on agreed Government goals and outcomes.
Our performance measures are integrated within the monthly performance evaluation process undertaken by the Corporate Executive Leadership team.
Alignment with Government Goals
The Western Australian Government has identified the following goals that we will contribute to in delivering its stated goals.
We achieve the delivery of the Government goals through an outcome based Program Management approach.
There are seven programs, or services, that drive outcome based decision making to achieve agreed business outcomes. The following table shows the alignment of each Program against the Government’s goals.
| Main Roads | Government | |
| Service (Program) | Outcome | Goal |
|---|---|---|
| Road Safety | A safe road environment | Outcome Based Service Delivery |
| Office of Road Safety | Improved coordination and community awareness of road safety | |
| Road Management | Reliable and efficient movement of people and goods | |
| Road Efficiency | ||
| State Development | Facilitate economic and regional development | State Building – Major Projects |
| Maintenance | A well maintained road network | Stronger focus on the Regions |
| Community Access | Improved community access and roadside amenity | Social and Environmental Responsibility |
Changes since the last report
The only change since the last period is the removal of the measures on availability of traffic signals, emergency phones and street lighting as part of our official Outcome Based reporting. Approval for this change was granted by the Under Treasurer in January 2014.
Future review of measures
The Government has requested that Main Roads, along with several other larger general government agencies, undertake a review of their outcome Based Management reporting in consultation with the Department of Treasury. The aim of the review is to seek greater transparency and alignment with individual programs and areas of activity. We are due to report through our Minister by November 2014 with a view to agreed changes being reflected in the 2015-16 State Government Budget Statements.
Understanding Community Perception Measures
Four of the measures are derived from an annual Community Perceptions Survey that seeks to reflect the satisfaction levels of customers in both metropolitan and rural areas of the State. These results are used to ensure that Main Roads’ projects and customer service initiatives are targeted at the areas of greatest need.
Through the use of an external research company, the data was collected by way of telephone interview using a developed structured questionnaire. The results are based upon a random and representative sample of 1 102 people (199 persons in the Metropolitan area and 903 persons in rural areas – approximately 100 from each Region).
When extending these results to estimate the percentage of satisfied Western Australians, the margin of error is approximately 2.9% at the 95% confidence level and is also weighted to reflect the actual population distribution based on ABS statistics. The full survey is available on the Main Roads website.
The four measures are Community Satisfaction with Main Roads, road safety, maintenance and provision of cycleway and pedestrian facilities.
Understanding On Time and On Cost Measures
The delivery of infrastructure in a State that is as climatically and geologically diverse as Western Australia provides many challenges. Ten of our efficiency measures are based on reporting against the delivery of our contracts in terms of time and cost. To recognise the complexity in achieving this, and consistent with approaches taken in other road agencies, all reporting against these measures includes a 10% margin when calculating the final outcome.
Structure
The following provides a summary of Main Roads’ program outcomes and measures for each indicator showing the trend over time as well as providing a status report as to how the results for 2013-14 compared against the targets agreed with Government. The remainder of this chapter provides commentary on the efficiency and effectiveness indicators grouped around the seven outcome based programs.
Summary of key performance measures and outcomes
Download a copy of our Key Performance Measures Manual.
| 2011 | 2012 | 2013 | 2014 Target | 2014 Actual | |||
| Road Safety Program | |||||||
|---|---|---|---|---|---|---|---|
| % Community Satisfaction of road safety | 95 | 92 | 94 | 90 | 95 | ||
| Black Spot location indicator | 11.2 | 10.7 | 10.3 | 10 | 10.0 | ||
| % of contracts completed on time | 61 | 67 | 70 | 90 | 100 | ||
| % of contracts completed on budget | 88 | 95 | 95 | 90 | 94 | ||
| Office of Road Safety Program | |||||||
| % Effectiveness of road safety awareness campaigns | 79 | 60 | 83 | 65 | 0 | ||
| % of ORS Projects completed on time | 90 | 87 | 78 | 90 | 83 | ||
| % of ORS Projects completed on budget | 88 | 97 | 100 | 90 | 95 | ||
| Road Efficiency and Road System Management Programs | |||||||
| % Community Satisfaction | 97 | 95 | 94 | 90 | 94 | ||
| Road network permitted for use by heavy vehicles | B Double -27.5m % | 96 | 96 | 97 | 96 | 97 | |
| Double RT -27.5m % | 96 | 96 | 97 | 96 | 97 | ||
| Double RT-36.5m % | 78 | 78 | 79 | 78 | 79 | ||
| Triple RT-53.5m % | 44 | 44 | 44 | 44 | 45 | ||
| % Network configuration | Roads | 89 | 89 | 89 | 89 | 90 | |
| Bridges | Strength | n/a | 87 | 88 | 87 | 89 | |
| Width | 94 | 95 | 95 | 94 | 94 | ||
| % of contracts completed on time | 57 | 55 | 86 | 90 | 89 | ||
| % of contracts completed on budget | 86 | 82 | 100 | 90 | 84 | ||
| Average $ cost of network management per million vehicle km travelled | 3,509 | 3,567 | 4,006 | 4,256 | 4,983 | ||
| 2011 | 2012 | 2013 | 2014 Target | 2014 Actual | |
| State Development Program | |||||
|---|---|---|---|---|---|
| Average return on construction expenditure | 2.7 | 2.1 | 3.1 | 3.3 | 5.4 |
| % of contracts completed on time | 71 | 33 | 100 | 90 | 75 |
| % of contracts completed on budget | 100 | 100 | 100 | 90 | 100 |
| Road Maintenance Program | |||||
| % Smooth Travel Exposure | 98 | n/a | 97 | n/a | n/a |
| % Community Satisfaction road maintenance | 94 | 90 | 84 | 90 | 90 |
| % Preventative maintenance indicator | 88 | 86 | 87 | 84 | 86 |
| Average $ cost of network maintenance per lane kilometre of road network | 6,126 | 7,907 | 8,231 | 7,900 | 8,125 |
| Community Access Program | |||||
| % of the year that 100% of the Main Roads’ State road network is available | 85 | 90 | 94 | 85 | 96 |
| % Community satisfaction with cycleways and pedestrian facilities | 90 | 76 | 83 | 90 | 85 |
| % of contracts completed on time | 50 | 80 | 80 | 90 | 75 |
| % of contracts completed on budget | 100 | 100 | 80 | 90 | 50 |
Road Safety
Outcome: Providing a Safe Road Environment
This program seeks to reduce the State’s road fatality rate to the lowest in Australia by minimising road factors contributing to road trauma and reducing the serious crash injury rate. We demonstrate this through the following measures:
Effectiveness Indicators
Community Satisfaction with Road Safety
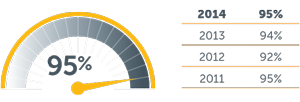 This indicator represents how satisfied the community is with Main Roads’ overall performance in the area of road safety. The survey results show that Main Roads’ high performance on road safety remains strong rising a further point since last year to achieve 95% of survey participants rating it as okay or better exceeding the target of 90%. The survey showed that the greatest areas of improvement were in the Gascoyne and South West Regions
Black Spot Location Indicator
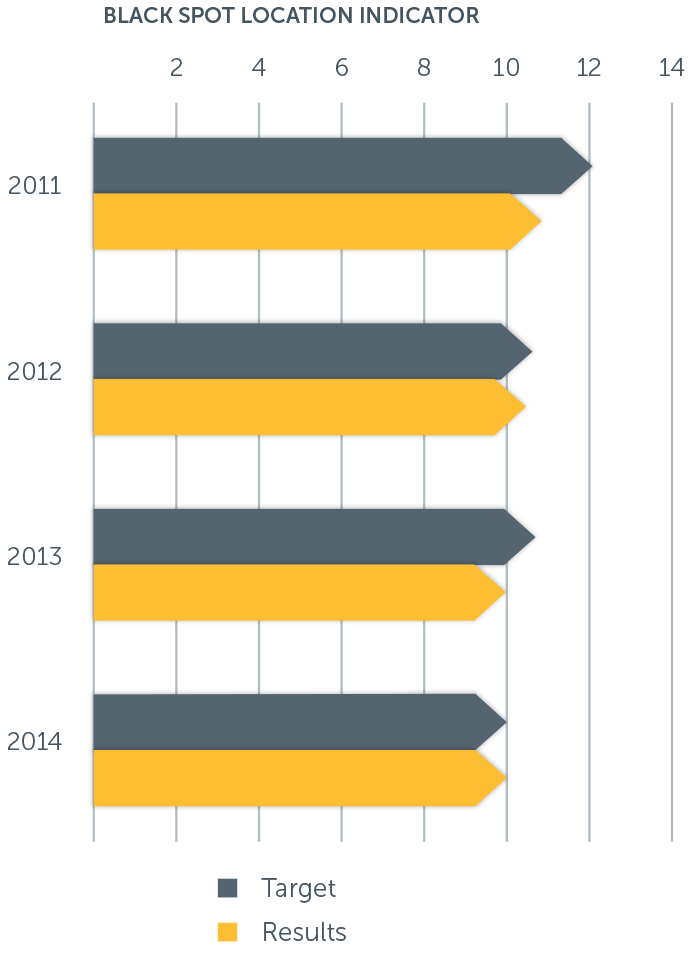
 The indicator gives a measure of the number of locations on the road network that meet State Black Spot criteria based on an analysis of crash history. The measure uses a sliding window to determine whether the number of locations eligible for funding is increasing or decreasing, taking into account the amount of travel in the State. The four year trend (shown right) continues to shows a gradual decline in the number of eligible black spot locations with the current result being the lowest recorded since the implementation of the Black Spot program in 2001, coming in below the estimated target.
Percentage of Contracts
Completed on Budget This indicator represents the percentage of contracts that were delivered on budget in the Road Safety Program. The result achieved was 94% of contracts delivered on cost which exceeds the target of 90%.
Of the three contracts that were over budget one was due to the works taking longer than anticipated, the second is currently being reviewed by the contract manager for approval to vary however, at the time of preparing the report it remains over budget, whilst the third contract is over budget due to a change in the scope of works and asphalt specification.
Office of Road Safety
Outcome: Improved Coordination and Community Awareness of Road Safety
This program represents the outcomes sought from the Office of Road Safety and their role in supporting the Minister for Road Safety and the Road Safety Council in coordinating and raising community awareness of the road safety effort for Western Australia. We demonstrate this through the following measures:
Effectiveness Indicators
Effectiveness of Road Safety Awareness Campaigns
This indicator represents the portion of Western Australian drivers who remember seeing major road safety community education campaigns with a mass media expenditure of more than $500 000 conducted by the Office of Road Safety. Community education expenditure was reduced due to the Government’s mass media review of road safety campaigns. During the year the following three road safety priority areas had mass media expenditure, drink driving, speed and safe vehicles. Despite this none of these individual campaigns were above $500,000, hence the zero result for this year.
Efficiency Indicators
 Percentage of Projects Completed on Time
This indicator represents the percentage of projects approved by the Road Safety Council and the Minister for Road Safety that were delivered on time by the Office of Road Safety, it excludes external bodies grant funded projects. The current year’s result shows that 83% of all projects were delivered on time which is only slightly below the target of 90% but reflects an improvement on last year’s result.
Percentage of Projects Completed on Budget
This indicator represents the percentage of projects approved by the Road Safety Council and the Minister for Road Safety that were delivered on budget by the Office of Road Safety. The current year’s result shows that 95% of all projects were delivered on cost ahead of the target of 90%.
Efficiency and Road System Management
Outcome: Safe and Efficient Movement of People and Goods
The Efficiency Program seeks to improve the efficiency, capacity and utilisation of the existing road network whilst the Road System Management Program seeks to optimise real-time management of the network, provide traveller information, asset management planning and to support service delivery throughout the organisation. Together these programs contribute to achieving the outcome. We demonstrate this through the following measures:
 Community Satisfaction
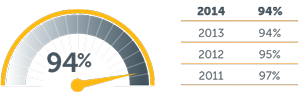
This indicator represents how satisfied the community is with Main Roads’ overall performance in the management and operation of the State road network. The survey results show that Main Roads overall performance remains high with 94% of respondents rating Main Roads’ performance as okay or better exceeding the target of 90%. The survey showed that the greatest area of improvement was in the Gascoyne Region.
Vehicles
This indicator relates to the efficient movement of goods within Western Australia and the percentage of available State roads accessed by B-Doubles, Double road trains and Triple road trains. The use of larger vehicles with greater payloads can increase the overall efficiency of freight transport operations, resulting in lower transport costs. However, to maintain road safety and guard against infrastructure damage, restrictions are placed on some trucks. Because of the relatively high efficiency of these vehicles, the proportion of roads accessible to them is an important factor in the overall efficiency of freight transport in this State. Over the past four years the trend has remained relatively consistent with most minor fluctuations in results attributed to changes in ownership of roads between State and Local Government and very minor variations with access categorisation.
| Type of Vehicle | 2011 | 2012 | 2013 | Target | 2014 |
| B Double – 27.5m | 96 | 96 | 97 | 96 | 97 |
| Double RT 27.5m | 96 | 96 | 97 | 96 | 97 |
| Double RT – 36.5m | 78 | 78 | 79 | 78 | 79 |
| Triple RT – 53.5m | 44 | 44 | 44 | 44 | 45 |
Network Configuration-Roads
This indicator shows the percentage of travel undertaken on roads meeting specific criteria for seal width, carriageway width and curve rating. The indicator gives a measure of the ability of Main Roads to plan for and maintain roads to desirable standards. In 2014, 90.4% of travel was undertaken on roads meeting the seal width, carriageway width and curve rating criteria which is in line with the target of 89%. The results over the four-year period are relatively consistent and demonstrate that Main Roads continues to plan and program works to address roads that are below the criteria.
Network Configuration – Bridges
Similar to the roads measure, bridges are assessed for strength and width using agreed investigatory criteria. The monitoring of bridge strength and width needs to ensure a safe and efficient road network relating to improved access and transport efficiencies. These measures are indicators for the number of bridges that meet, or are above, the investigatory criteria, recorded as a percentage of the total number of bridges on main roads and highways. Therefore, the percentage of bridges meeting these network configuration criteria should continue to rise but only slightly in future years. All bridges that do not meet the investigatory criteria for strength or width are considered in assessing, scoping and prioritising works, as part of the ten year bridge strategy. During the year four new bridges were added to the State’s bridge stock and these additional assets all met width and strength criteria.
Strength – The results of this indicator show that 89% of the bridges meet the agreed criteria for strength against a target of 87%. Width – In relation to width 94% of bridges meet the criteria against a target of 94% which is consistent with previous years.
Efficiency Indicators
Percentage of Contracts Completed on Time
 This indicator represents the percentage of contracts that were delivered on time in the Road Efficiency Program. Whilst the target was established at 90%, 89% of contracts were delivered on time which is a consistent with last year. Of the two contracts that were late only one exceeded the target date by more than 10 days, in that instance the delays were due to drilling and ground conditions associated with bores, an extension of time was issued however, it remained insufficient to complete the works on time.
Percentage of Contracts Completed on Budget
This indicator represents the percentage of contracts that were delivered on budget in the Road Efficiency Program. Whilst the target was established at 90%, the result of 84% is below the target. Of the three contracts over budget one was due to a burst Water Corporation well, the second arose as a result of the design costs being higher than originally estimated and the third was due to an increase in the scope of works to include a bus shelter and related works.
Average Cost of Network Management
This indicator measures the financial efficiency of the Road System Management program in terms of cost per million vehicle kilometres travelled to manage the road system. In order to compare current figures with previous years all figures have been adjusted and reported in terms of current year’s dollars. The overall four year trend is inconsistent as this program includes occasional one-off development costs that can affect the overall results. In respect of the current year the result of $4, 983 per million vehicle kilometres travelled exceeds the target.
The trend for this measure is showing a gradual increase which reflects an increase in the provision of non-infrastructure services including heavy vehicle services and increased focus on addressing congestion.
State Development
Outcome: Facilitating Economic and Regional Development
This program expands the road network in accordance with State and Commonwealth transport and land use strategies that will facilitate the economic and regional development of the State. We demonstrate this through the following measures:
Effectiveness Indicators
Return on Construction Expenditure
New road and bridge construction add to the capacity of the road network. Return on Construction Expenditure is based on Benefit Cost Ratio (BCR) estimates of a set of projects undertaken each year. It indicates the extent to which road and bridge construction expenditure will deliver future economic benefits to the community. This indicator represents the expenditure weighted BCR for the State Development Program and Road Efficiency program for which a BCR has been calculated.
The result of 5.4 greatly exceeds the target of 3.3, this is largely attributed to the large BCR generated by projects on the Graham Farmer Freeway that were not originally included in the target when it was established, although was highlighted during the development of the 2013-14 State Budget Papers.
Efficiency Indicators
 Percentage of Contracts Completed on Time
This indicator represents the percentage of contracts that were delivered on time in the State Development Program. The result achieved was 75% of contracts being delivered against a target of 90%. The result actually reflects only one contract being delivered late and work on this contract is still underway. The contract relates to the Bunbury Port Access Project and this specific piece of work only represents one element of a range of contracts currently underway on these works.
Percentage of Contracts Completed on Budget
This indicator represents the percentage of contracts delivered on budget against a target of 90% in the State Development Program. The result achieved was 100% of contracts being delivered on budget which is consistent with last year’s result.
Road Maintenance
Outcome: Providing a Well Maintained Road Network
This program seeks to maintain the existing road and bridge network by maximising asset life and minimising whole of life costs. We demonstrate this through the following measures:
Effectiveness Indicators
Community Satisfaction of Road Maintenance
 This indicator represents how satisfied the community is with Main Roads overall performance in the maintenance of the State road network. The survey results show that Main Roads rating has improved since last year achieving 90% of survey participants rating it as okay or better coming in on target. The survey showed that the greatest areas of improvement were in the Gascoyne and Wheatbelt North Regions.
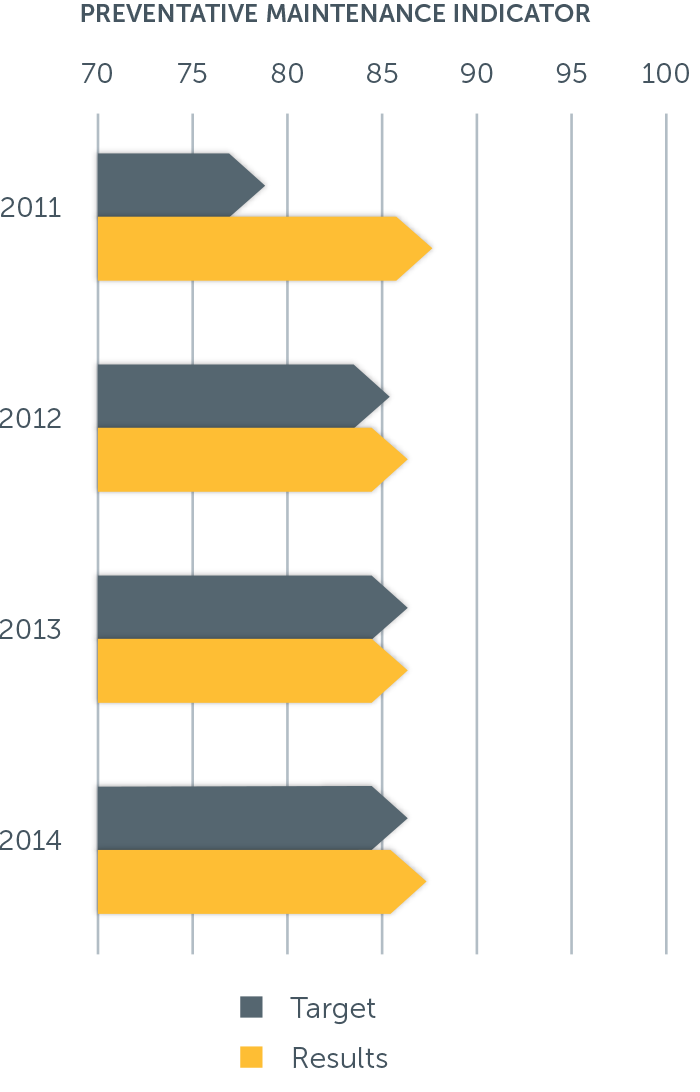
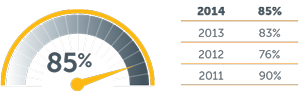
Preventative Maintenance Indicator
The Preventative Maintenance Indicator provides a measure of the proportion of sealed state road network which has a surfacing age younger than its optimal target age. The indicator provides a measure of proactive maintenance undertaken on the network on an annual basis. Sections of the network with a surfacing age younger than target age are classified as ‘Good’. In 2014, the proportion of the network with a surfacing age considered ‘Good’ is 85.8% which is above the target value of 84%.
In reviewing the methodology an error was discovered in the calculation of the target age resulting in the percentage of pavement being rated as good being overstated by between one and two per cent over the last four years. Based on these differences the error was assessed as not being significant, however, we have revised the figures to show the revised results.
Overall the results for the four-year period remain consistent and the current year’s results are in accordance with the target.
Smooth Travel Exposure
This indicator is based on the percentage of travel undertaken on the State road network meeting specific roughness criteria. In 2011 a decision was made to only capture the information used in reporting this data on a biennial basis. The period 2013-14 is a non-reporting period, the next result will be reported in 2014-15.
Efficiency Indicators
Average Cost of Network Maintenance per Lane Kilometre of Road Network
This indicator identifies the financial efficiency of road and roadside maintenance works by showing the cost per lane kilometre to maintain acceptable travel conditions on the State roads. In determining the cost basis expenditure on structures and infrastructure depreciation has been excluded.
In order to compare current figures with previous years all figures have been adjusted and reported in terms of current year’s dollars which can influence the trend result. The overall trend for this measure remains inconsistent with the current result indicating that the measure came in above target by $225. The reason for the inconsistency continues to be a largely as a result of high levels of expenditure arising from a variety of declared Natural Disasters that have occurred since 2012.
Community Access
Outcome: Improving Community Access and Roadside Amenity
This program seeks to provide infrastructure that will increase personal mobility and community access. We demonstrate this through the following measures:
Effectiveness Indicators
Unplanned Road Closure on the State Road Network
Generally 100% of Main Roads sealed network is available to all road users; however, there are unplanned road closures due to a number of reasons including flooding, cyclones, major bushfires and major road accidents, which may vary in duration. The availability of the sealed road network is measured as a percentage of calendar days that the whole network is available to the road user. Closure is determined by measuring the number of whole days (24 hours commencing from the time the road is closed) that any section of the sealed road network is closed. This year the road network was available 96% of the year which exceeds the 85% target which was increased last year. All closures were due to flooding and rainfall events.
 Community Satisfaction with Cycleways and Pedestrian Facilities
This indicator represents how satisfied the community is with Main Roads’ performance in the construction, maintenance and management of cycleways and pedestrian facilities. The survey result shows that Main Roads rating has improved since last year achieving 85% against the target of 90%. The survey showed that the greatest areas of improvement were in the Gascoyne, Wheatbelt South and Goldfields/Esperance Regions.
Efficiency Indicators
 Percentage of Contracts Completed on Time
This indicator represents the percentage of contracts that were delivered on time in the Community Access Program. Whilst the target was established at 90%, 75% of contracts were delivered on time. Only one contract was late which was due to unexpected issues related to the structural integrity of an existing river wall. Approval has been sought for an extension of time however, at the time of preparing this report the matter was still under consideration.
Percentage of Contracts Completed on Budget
This indicator represents the percentage of contracts delivered on budget against a target of 90%, the result of 50% reflects that two contracts were over budget. In one case the design costs were higher than estimated and in the second instance unsuitable material was found during construction and had to be removed and replaced.