
To understand our customer and stakeholder needs, and create a consistent and centralised approach to communication and stakeholder engagement across the organisation.
We achieve this by
It's a great time for the State as we continue to evolve and plan for a growing population. As we plan for this growth we believe that it is essential to take our customers on this journey with us as we seek to understand their needs and what they value. This section of the report includes information on customer profiling, our community and stakeholder surveys, our advisory groups and customer feedback.
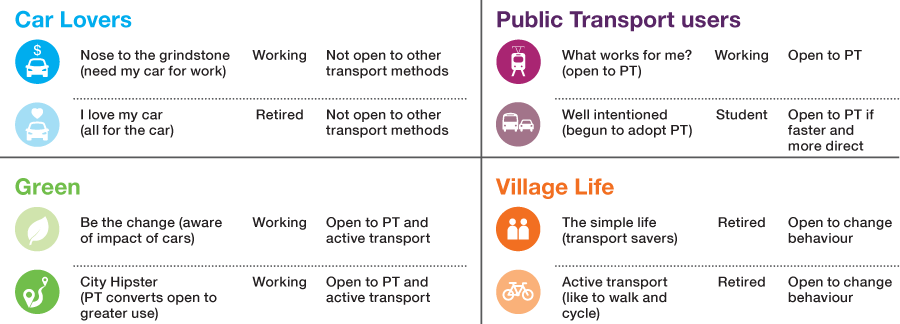
Customer profiling and segmentation allows us to better understand how our customers use the transport network and what their information requirements are. While levels of service and service expectations are not yet known, we have identified four customer behaviour and belief profiles for metropolitan residents:
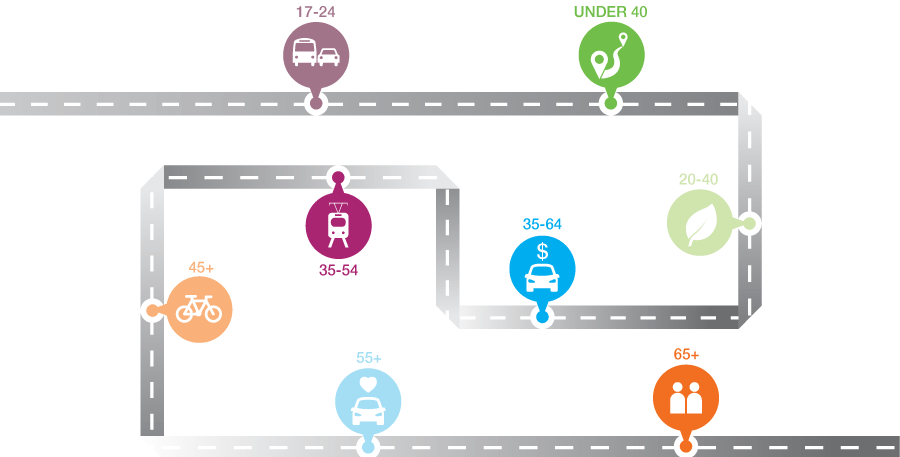
We will now use this information to help us understand preferences and emerging travel trends within changing demographics and assist us in determining underlying factors impacting travel choices and decisions. It also begins to give us some information around which segments can be influenced and who we can provide more targeted information to. In the future we will be conducting further research to build regional customer behaviour and belief profiles across the State.
We have conducted the Community Perception Survey every year since 1994. It tracks our performance on issues such as road safety, cycling and pedestrian facilities and maintenance of the road network, as well as the community's overall satisfaction of our performance.
Satisfaction with:
Our Overall Perormance
Road Safety
Provision of Cycle Ways and Pedestrian Facilities
Road Maintenance

This year the survey identified the following priority areas:
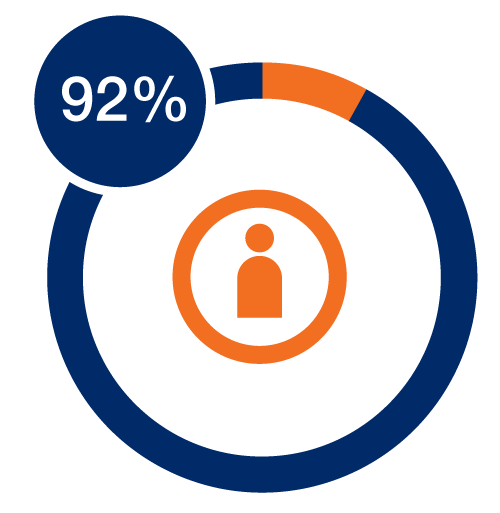
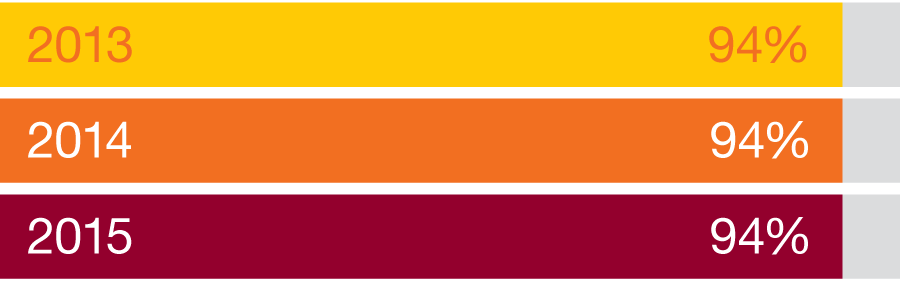
To better understand stakeholder needs, we conduct a biannual survey to find out how they rate our interactions and communications. The overall ratings of our stakeholders remain high with 92% considering our interactions to be “okay, good or excellent” in 2015 compared to 94% in 2013.
We provide a 24 hour 365 days a year service through the Customer Information Centre which plays an important role in State-wide incident management and provides timely and accurate information to the public.
The introduction of self service options has improved services for customers. While call volumes are consistent, our reach to the community has improved through the growth in our social media channels and associated online services including the Right Move Perth app and Get the Bigger Picture website.
|
Customer Contact Statistics |
2013 |
2014 |
2015 |
|---|---|---|---|
|
Telephone calls |
150,234 |
117,105 |
119,400 |
|
Email enquiries |
18,104 |
21,118 |
21,270 |
Our Customer Information Centre was recognised at the Auscontact Association State Awards this year, winning the Customer Contact Centre Award (under 30 full time employees).
We regularly report on, and investigate trends and issues arising from customer feedback to provide insights to business areas. Over the past three years, we've seen large increases in customer requests, with this year double from last year, and seven times more than 2013.
|
Feedback Type |
2013 |
2014 |
2015 |
|---|---|---|---|
|
Complaint |
2,789 |
2,912 |
3,232 |
|
Customer request |
456 |
1,712 |
3,450 |
|
Compliment |
218 |
273 |
254 |
|
Business improvement |
55 |
38 |
47 |
|
Total |
3,518 |
4,935 |
6,983 |
The top complaints in 2015 were:
For information on our Complaints Handling Process refer to the Governance section or visit our website.
Our customer service standard outlines the minimum levels of service that we provide. We regularly monitor and report on our achievements against these standards using the customer service charter index. This index is made up of a number of operational and strategic measures which align to delivering services to the community. We publically report on these measures every quarter and publish the results on our website.
This year we launched a Facebook account to provide updates on what we are doing around the State and to keep in touch with the community, it complements our existing Twitter and YouTube accounts.
Twitter is a highly successful method of notifying road users of incidents or disruptions on the road network. We continue to grow our following and our @perth_traffic and @WA_roads accounts are used by other agencies and the media for real time traffic updates.
Our Twitter followers:
We launched a Facebook page in September 2014 and have seen a steady growth in likes, shares and comments. In less than a year, 3,106 people like our page, most of which are in the 25-34 age range with slightly more females than males. We post topics ranging from road information, driving tips and the popular Throwback Thursday photos.
YouTube allows us to showcase some of the services and network changes that occur as part of business. This year, we uploaded 27 videos ranging from revegetation case studies, 3D fly-through animations of road projects and information for the heavy vehicle industry.
The Customer Service Advisory Council was established in 2006 to provide an independent assessment of our customer service delivery and standards.
The Council meets four times a year and provides us with feedback and direction on:
The Council is independently chaired by Principal of Huntingdale Primary School, Edd Black, and includes community and industry members.
To ensure that our operations are open, accountable, fair and flexible, we collaborate with a wide range of customers and stakeholders who provide essential input to operational aspects of our business. The table below lists our various advisory groups and the frequency of meetings.
|
Advisory group |
Meeting frequency per annum |
|---|---|
|
Customer Service Advisory Council |
4 |
|
Cycling and Pedestrian Advisory Group |
3 |
|
Disability Advisory Group |
12 |
|
Western Australian Road Construction and Maintenance Industry Advisory Group |
4 |
|
State Road Funds to Local Government Advisory Committee |
3 |
|
Traffic Management for Works on Roads Advisory Group |
4 |
|
Traffic Management for Events Advisory Group |
4 |
Our five-year Disability Access and Inclusion Plan (DAIP) was launched in 2012. The DAIP aims to achieve the Government's vision for a better quality of life for all Western Australians. It recognises that people with disabilities, their families and carers have the same rights to access our services and employment opportunities as any other member of the community. The DAIP emphasises how we have been addressing the needs of people with disabilities since its inception in 1995. It provides a suite of implementation strategies built around seven outcomes.
A copy of the plan and our progress is on our website. The next DAIP, for 2017 to 2021, will be developed during 2016 to continue these outcomes and strategies.
We engage with the community on major projects where there are high levels of complexity and there are expected to be significant impacts that affect the community or where there is potential for enhancing community outcomes. In accordance with our Community Engagement Policy, each project has Reference/Working Groups that represent the community. We advertise an Expression of Interest to the community to become members of these Groups who are decided through a selection criteria process. More information is available on our website.
In instances when extra land is required to improve existing roads or to provide new transport corridors, land is acquired by negotiation or 'formal taking action' under the powers contained in the Land Administration Act 1997. The process of acquiring land can have significant community and social impacts. We aim to commence acquisition of land two years prior to construction. Land owners have certain rights under the Act such as they are able to object to the land take proposal, and are entitled to compensation. Further information is available on our website.
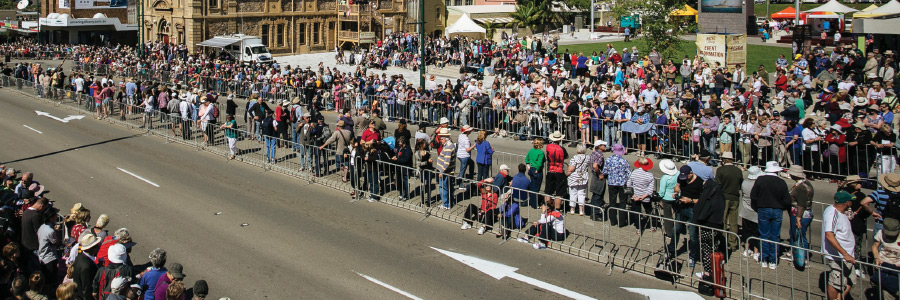
For nine months, our Great Southern Region team worked with internal and external stakeholders to prepare for the commemorative event attended by the Governor General, the Australian and New Zealand Prime Ministers, the Western Australian Premier and many foreign dignitaries.
Traffic volumes were monitored during the event along all major routes into Albany through:
Other road management activities included electronic Variable Message Boards broadcasting live message updates on the route and the successful trial of traffic lights at Chester Pass Road Roundabout.
We worked with stakeholders such as City of Albany, Department of Fire and Emergency Services, WA Police and St Johns Ambulance to comprehensively update regional emergency management plans. We also sought input from internal stakeholders such as South West Region, Wheatbelt Region, Metropolitan Region and Road Network Services Directorate to mitigate risks to road users and the road infrastructure.
Our effective approach resulted in a crash-free network and minimal congestion and delays giving everyone safe and timely travel to and from the event.
The event's traffic management and incident management planning was a complicated task given the forecast, levels of congestion and the heightened security around the event.
CONNECT WITH US