Managing the Environment

Download this section (701 KB)

Aim

Committing to protecting and enhancing the natural environmental and social values in all our activities

Approach

Our staff and others working on our behalf will:

  • recognise the importance of natural environmental and social values and the broader benefits that these provide for the community
  • foster strategic relationships with community and other stakeholders to contribute to the management of environmental values
  • facilitate environmental governance of our activities to deliver broad community benefit through inclusion of environmental requirements in planning, programming, constructing and maintaining processes
  • communicate publicly our environmental policy and our environmental performance.
Key Performance Indicators
Results
Percentage of state-wide clearing permit audits of compliance completed continues to meet our target

Percentage of state-wide clearing permit audits of compliance completed continues to meet our target

Scope 1 and 2 Emissions (t CO2) are lower than expected and continue to come in under target

Scope 1 and 2 Emissions (t CO2) are lower than expected and continue to come in under target

Community satisfaction with our sustainability practices exceeded our target with an increase from last year

Community satisfaction with our sustainability practices exceeded our target with an increase from last year

Community satisfaction of our intent towards managing our impact on the environment target was achieved and was an improvement on last year

Community satisfaction of our intent towards managing our impact on the environment target was achieved and was an improvement on last year

Looking Ahead

Projects and activities planned for next financial year, some of which have already commenced, include the following:

  • embed a strategic approach within government processes to meet environmental and road safety objectives in the agricultural region of Western Australia
  • launch the revised environmental specifications for our contracts to drive improved environmental performance
  • continue implementation of the Wildflower Capital Initiative at key sites within the Metropolitan Region including on the Mitchell Freeway and at the Narrows and Mounts Bay Road approach to the Point Lewis Roundabout. Approximately 32,850 native Western Australian species will be planted
  • disseminate information gathered through the Aboriginal Journey Ways Project to road users and the
  • general public
  • renew or replace Main Roads’ State-Wide Clearing Permit CPS818, which is used to clear native vegetation for approximately 70 project activities throughout the state each year
  • deliver high-quality impact assessments that meet regulatory standards and obtain timely environment and heritage approvals for our projects
  • continue the roll out of the Infrastructure Sustainability rating tool Version 2.0, for major projects within our project development processes
  • progress plans to utilise 100,000 tonnes crushed recycled concrete and double the usage of crumbed rubber to 1,200 tonnes in road construction
  • support the Memorandum of Understanding for sub-national collaboration on increasing the uptake of electric vehicles
  • review the sustainability key aspect management plans that underpin our sustainability policy including setting a new approach for our Carbon Reduction Plan.

Our Unique Environment

As managers of the State Road Network we acknowledge that Western Australia’s environment is significant from a global perspective and taking into account the conservation values in our road reserve. This is demonstrated, as the table below shows; by the significant number of threatened flora and fauna species located or having habitats in our road reserves. We have a responsibility to protect the unique flora and fauna that may be affected by our operations and ensure we minimise our environmental impacts. The tables use IUCN (International Union for the Conservation of Nature) Red List categories.

Number of Threatened Species with Habitats Located in the Main Roads Reserve

IUCN Classification Flora Fauna Total
Critically Endangered 31 2 33
Endangered 26 15 41
Vulnerable 26 24 50
Near Threatened 572 32 604
Total 655 73 728

Data for flora obtained from Western Australian Herbarium and Threatened Priority Flora records maintained by the Department of Biodiversity, Conservation and Attractions (DBCA). Data for fauna species obtained from the State Threatened Fauna records maintained by DBCA. Note that the majority of near threatened flora and fauna species are not recorded or reported. None of the flora and fauna species of least concern (i.e. no ranking) have been reported here.

Our road network transects: sensitive and protected environmental areas such as Ramsar wetlands, wetlands of international importance; threatened ecological communities; environmentally sensitive areas; conservation areas; Bush Forever sites; and habitat for threatened fauna such as Baudin’s Black Cockatoo, Carnaby’s Black Cockatoo, Forest Red-Tailed Black Cockatoo, Northern Quoll, Greater Bilby and Western Ring-Tailed Possum. To view maps of these environmentally sensitive and protected areas in relation to our roads please refer to our website.

Environmental Management of Road Projects

We use the precautionary principle in our approach to environment and heritage and aim to avoid and minimise impacts wherever possible. The precautionary principle is built into our internal processes and Western Australian environmental legislation.

We manage our operations using a systematic approach in which all our activities are screened for potential environmental impacts. Environmental impacts can include positive or negative changes to the values of our environment. Values impacted might be: physical, that is, land, water and air; biological meaning flora and fauna; cultural and heritage related values; and socio-economic and human-health values. If potential impacts are negligible then the activity is implemented using standard management measures. If potential impacts are identified, the activities require further impact assessment.

We operate on a hierarchy of avoid, minimise, reduce and offset our environmental impacts. This is achieved primarily through changes in scope and design, and the development and implementation of an Environmental Management Plan (EMP) and an Offset Proposal.

OFFSET3

Where the environmental impacts are likely to be significant and relate to more than just the clearing of native vegetation, we refer our projects to be assessed by the relevant regulators such as the Western Australian Environmental Protection Authority (EPA) or the Commonwealth Department of the Environment and Energy (DotEE).

The regulator will decide whether or not to assess the project. Where the regulator does not assess the project, the project is implemented in accordance with the relevant EMP. Where the regulator assesses the project, it is subject to a comprehensive Environmental Impact Assessment and may be open to extensive public consultation. 
We do not implement projects assessed by the regulators until they are approved, and the relevant approval conditions have been met.

Environmental Management of the Road Network

At a regional level, network environmental risk is managed through its Regional Environmental Management Plans. The activities delivered through Term Network Contracts are screened for environmental impacts and the risks managed through Construction or Maintenance Environmental Management Plans. These detail how the Region’s implement their ISO 14001 requirements. Some of the environmental operational controls that are implemented under these are:

  • Water Bore Management Plans
  • Pit Management Plans
  • Aggregate Stockpile Plans
  • Special Environmental Area Registers
  • Revegetation Plans.

Environmental Management of Buildings and Depots

We manage the safety, environment and property risks of each of our depots through Depot Management Plans (DMP), Depot Inspections and Depot Compliance Checks. A DMP, details how they manage safety, health and wellbeing, environment and property management requirements. In addition to the plans, regular depot inspections and compliance checks are conducted to ensure that the DMP are being complied with. Corporately there are quarterly Depot Management Meetings where incidents, results from compliance checks and inspections, innovations, feedback and corporate templates are discussed.

Screening all Projects for Impacts

Of the 398 projects that we screened in 2018 for potential environmental impacts we concluded that 178 of these were low impact and could be managed through standard management actions. 220 projects required further investigations through Main Roads Environmental Impact Assessment, Management and Compliance process.

  2016 2017 2018
No. projects screened 305 431 398
No. projects assessed as low impact 144 206 178
No. projects subject to further impact assessment 161 225 220

Data is based on calendar year

Clearing Native Vegetation

In 2018 we assessed 114 projects under CPS818, 38 of which were referred to the Department of Water and Environmental Regulation (DWER) for assessment in accordance with the permit conditions and 65 projects were delivered.

  2016 2017 2018
No. projects assessed under CPS818 82 63 114
No. projects referred to DWER under CPS818 41 30 38
No. projects cleared under CPS818 68 70 65

Data is based on calendar year

In 2018 we applied for 21 project-specific Clearing Permits, 14 were granted, and seven were appealed. In 2018 10 projects were cleared under project-specific clearing permits.

  2016 2017 2018
No. project-specific clearing permit applications 16 15 21
No. project-specific clearing permit applications granted 22 13 14
No. project-specific clearing permit applications appealed 1 3 7
No. projects cleared under project specific clearing permit 2 3 10

Data is based on calendar year

Projects with Potentially Significant Environmental Impacts

In 2018, two projects were referred to the EPA for potential assessment under s38 EP Act. The EPA assessed one project, which the Minister for the Environment approved in May 2019.

  2016 2017 2018
No. projects referred to the EPA 1 1 2
No. projects assessed by the EPA 1 1 1

projects approved by the Minister for the Environment 

1 0 0 *

Data is based on calendar year. *The project that was assessed by the EPA in 2018 was approved by the Minister for Environment in May 2019

In 2018, seven projects were referred to the DotEE for potential assessment under the EPBC Act. The DotEE assessed two projects, including projects referred in previous years. Five projects received approval under the EPBC Act in 2018.

  2016 2017 2018
No. projects referred to the DotEE 11 10 7
No. projects assessed by the DotEE 6 3 2

No. projects approved by the Commonwealth Minister for the Environment

3 4 5

Revegetation and Offsets

We strive to find a balance between achieving road safety objectives and the environment and it is not always possible to avoid the clearing of native vegetation. We reduce our clearing footprint where possible by changing the project scope and design, restricting earthworks limits for projects, steepening batters, installing barriers, establishing borrow pits in cleared paddocks and avoiding temporary clearing for storage, stockpiles and turn around bays. Where avoidance is not possible, and after seeking to minimise and reduce our impacts, we then seek to offset our impacts.

In 2018, we cleared 535 hectares of native vegetation for the delivery of 104 projects. To mitigate the negative impacts of this clearing we undertook 139 hectares of revegetation works of which six hectares was required under a legislative approval. We provided offsets in the form of $557,844 to the Western Australian Environmental Offsets Fund for the purchase and management of 324 hectares of native vegetation. Approved project offsets can be viewed via the Department of the Environment and Energy website or the Government of Western Australia Environmental Offsets Register.

The table below summarises our clearing, revegetation and offset activities over the past three years.

    2016 2017 2018
Clearing (ha)   487  246  535 
Total revegetation (ha)   287 206 139 
Offset         
Revegetation (ha)  (a) 3 83 6
Land acquisition (ha)
(Value of land acquired ($))
(b) 3,285
(16,642,883)
None settled None settled
Financial contribution ($)
(Area of land to be acquired using the financial contribution (ha) 
(c) 3,077,979
(691)
1,976,567
(1,738)
557,844
(318)
Total offset (ha) (a+b+c)   3,979 1,822 324 


Fauna Bridge Our Stories Page 71
Read the story

ENVIRONMENT

Animal Welfare a Priority with Our First Fauna Bridge

Along with 37 new road bridges, nine new interchanges and more than 150 kilometres of road safety barriers, NorthLink WA features the state’s first dedicated fauna...

Aboriginal Heritage

We acknowledge the traditional custodians of Western Australia’s lands and aim to protect Aboriginal cultural values wherever possible. We seek to achieve full compliance with statutory requirements and have developed an Aboriginal heritage process that ensures compliance with Western Australia’s Aboriginal Heritage Act 1972. We also work closely with other state government agencies including the Department of Planning, Lands and Heritage (DPLH) and the Department of Premier and Cabinet to ensure our Aboriginal heritage processes are robust.

We aim to avoid, minimise, and reduce impacts to Aboriginal heritage sites wherever practicable. All our activities are screened for potential impacts in compliance with the DPLH Due Diligence Guidelines using our internal Aboriginal Heritage Risk Assessment. In 2018 we screened 503 projects for potential impacts to Aboriginal Heritage Sites and determined that 402 of these were low impact projects, while 101 projects required further assessment.

  2016 2017 2018
Aboriginal Heritage Risk Assessments 449 479 503
No. projects considered low risk (no further assessment) 299 353 402
No. projects not considered low risk (further assessment required) 152 126 101


Where it is not possible to avoid impacts to an Aboriginal heritage site, Main Roads will seek consent and will not proceed with the works without obtaining approval from either the Registrar of Aboriginal Sites or Minister for Aboriginal Affairs. Prior to the application for an approval, we will undertake consultation with the relevant Traditional Owners.

We value the input and contribution of Traditional Owners and seek, via site surveys and other consultation processes, their advice and opinions regarding potential impacts. In our endeavour to protect Aboriginal cultural values we also liaise with other stakeholders including Prescribed Body Corporates, Native Title Representative Bodies and Aboriginal Corporations and we directly engage with relevant community groups. Throughout 2018, we conducted 48 Aboriginal heritage surveys (ethnographic, archaeological or a combination of both) across Western Australia with 24 different Aboriginal groups. Of these surveys, 17 were commissioned via heritage consultants and 27 were conducted in line with a Heritage Agreement.

Where the works will not impact an Aboriginal heritage site in a negative way, an application under Regulations 7 and 10 of the Aboriginal Heritage Regulations 1974 is submitted for approval by the Registrar of Aboriginal Sites (Regulation 10). Where the impacts have the potential to be significant, an application under Section 18 of the Aboriginal Heritage Act 1972 (Section 18 approval) is submitted for approval by the Minister for Aboriginal Affairs. Prior to the application for a Regulation 10 or Section 18 approval, we will undertake consultation with the traditional custodians.

In 2018, we applied for two Regulation 10 approvals and were granted three, including an application from a previous year. We applied for 12 Section 18 approvals and were granted 23, including applications made in previous years.

  2016 2017 2018
Regulation 10 Applications Submitted** 2 7 2
Regulation 10 Applications Granted** 2 6 3
Section 18 Applications Submitted* 19 26 12
Section 18 Applications Granted* 18 23 23

* Applications under the Western Australian Aboriginal Heritage Regulations 1974 submitted or granted between 1st January to 31st December 2018.
** Applications under the Aboriginal Heritage Act 1972 (WA) submitted or granted between 1st January to 31st December 2018

Committed to Continual Improvement

Environmental Policy

We are committed to the protection and continual enhancement of the environment. This is communicated internally and publicly through our Corporate Environmental Policy. The key objectives outlined in our policy include:

  • deliver our services in full compliance with the obligations of environmental legislation and policy, as a minimum standard
  • manage environmental impacts of our activities through the hierarchy of avoid, minimise, rehabilitate and offset
  • contribute to a sustainable transport system through the delivery of products and services that minimise environmental impacts, conserve natural resources and also achieve positive social and economic outcomes
  • implement, maintain and continually improve an effective environmental management system compliant with ISO 14001:2015 across Main Roads activities.

Environmental Management System

We have an independently certified Environmental Management System (EMS) to ISO14001:2015. The EMS ensures that we protect and enhance the natural environmental and social values in all our activities and we continually improve our environmental performance. Our EMS covers our processes and activities undertaken by personnel who work for and with us, and that have the potential to impact on the environment. The EMS ensures compliance with our legal obligations and provides the framework for driving environmental and heritage requirements throughout our leadership, planning, support, operation, performance evaluation and improvement actions.

Through the implementation of our EMS we aim to enhance our environmental performance, fulfil our compliance obligations and achieve our environmental objectives.

Management of Environmental Incidents

All regions and operational areas in Main Roads prepare for the possibility of significant environmental incidents by ensuring that there are systems and processes in place to ensure valid contingency planning and incident response.

Main Roads environmental incident reporting and investigation process reflects the risk classification adopted across the Transport Portfolio agencies, with 5 categories of incidents (catastrophic, major, moderate, minor and insignificant).

The environmental incident reporting and investigation process applies to Main Roads as well as to Third Parties (i.e. an organisation or a person not employed by or working on behalf of Main Roads). The significant Third Party and Main Roads Environmental Incidents that occurred last year are outlined below.

Significant Incidents (Moderate, Major and Catastrophic) 2016 2017 2018
Incidents caused by Third Parties 4 3 9
Incidents caused by Main Roads or people working on Main Roads behalf 11 19 33

Data is based on calendar year. Significant incidents are those defined as Moderate, Major or Catastrophic according to Transport Portfolio risk classification process. Minor and insignificant incidents have not been reported here.

There were no catastrophic Third Party or Main Roads incidents in 2018.

Two major Third Party and three Main Roads incidents occurred in 2018. The two Third party incidents classified as major related the disturbance of a known Declared Rare Flora (DRF) site and the spill of approximately 40,000 litres of diesel due to a truck roll over on the Main Road’s road network.

Of the three major Main Roads incidents, one related to unauthorised disturbance of native vegetation adjacent to a known threatened (declared rare) flora site (no impact to DRF plants), while two incidents related to the unauthorised clearing of native vegetation.

The incident relating to unauthorised disturbance of native vegetation adjacent to a known threatened flora site was subject to a formal incident investigation. 
The incident investigation concluded that the works did not impact the threatened flora and the clearing of native vegetation was authorised, however DBCA should have been notified at least one month prior to the works commencing in accordance with Main Roads Permit to take Threatened Flora. The incident investigation recommended the following actions that have now been completed;

  • Notify DWER and the Department of Biodiversity, Conservation and Attractions (DBCA) of the incident and investigation outcomes,
  • Undertake additional training for operation staff regarding DRF and the DRF permit requirements, and
  • Update and communicate Main Roads procedures for the demarcation of significant environmental areas as exclusions zones.

The two incidents relating to unauthorised clearing of native vegetation are summarised below:

  • Clearing of 6.47 hectares was undertaken prior to completion of a fauna management action. Works were stopped immediately upon identification of the incident, and a formal incident investigation was completed. The incident and investigation was reported to DotEE and DWER. No fauna were injured or killed as a result of the incident.
  • Clearing of 0.02 hectares was undertaken outside of the approved clearing area due to operational error and confusion between the pegged and mapped project boundary and the approved clearing boundary. Once the incident was identified, the works were stopped immediately and a formal incident invitation was completed. The incident and investigation was reported to DWER.

The remaining 37 incidents were classified as moderate with seven caused by Third Parties and 30 caused by Main Roads or our contractor’s actions. 

These 37 incidents related to; spills (28), unauthorised clearing (6), working outside of normal hours without an approval (1), non-compliance with an approval (no environmental impact) (1) and impact to ground / surface water (1).

No penalties or financial sanctions related to these incidents. We addressed these procedural failures through training, changes in processes and increased compliance audits to ensure they are not repeated.

Sustainability Assessment in Projects and Operations

For our highest value major projects we have adopted the Infrastructure Sustainability (IS) rating tool, Australia’s only comprehensive rating system for evaluating sustainability across design, construction and operation of infrastructure. All infrastructure projects exceeding $20 million utilise the IS framework as part of project development and evaluation. Three programs and two individual projects have been registered for an IS Rating. 

The Bunbury Outer Ring Road is the first ever project registered for an IS Planning Rating. The NorthLink Southern Section was verified as having a Leading As Built rating of 95.2 points, the highest under IS to date.

Stand-alone public sustainability reports are produced for our projects with IS obligations. This year a Public Sustainability report was submitted by: Great Northern Highway Muchea to Wubin Stage 2 Upgrade; NorthLink WA – Central Section: Reid Highway to Ellenbrook; NorthLink WA Northern Section: Ellenbrook to Muchea; the Metropolitan Roads Improvement Alliance; Kwinana Freeway Northbound Widening; Smartways Alliance; Wanneroo / Ocean Reef Road and Marble Bar Road – Coongan Gorge Realignment. For more information on IS and to view the project sustainability reports please go to our website.

The following table lists all projects greater than $100 million that have been formally registered for an IS rating and their current status.

Project IS Version Current Rating Phase Target Rating Tracking Status
Great Northern Highway Muchea to Wubin Stage 2 Upgrade
Overall Program 1.2 First Round Interim Design Commended Commended
Muchea North 1.2 As Built (complete, not verified) Commended Commended
New Norcia Bypass 1.2 As Built (complete, not verified) Commended Commended
Walebing 1.2 As Built  Commended Commended
Miling Bypass 1.2 As Built (complete, not verified) Commended Commended
Miling Straight 1.2 As Built (complete, not verified) Commended Commended
Pithara 1.2 As Built  Commended Commended
Dalwalinu to Wubin 1.2 As Built  Commended Not Started
NorthLink WA
NorthLink WA Southern Section 1.2  As Built  Excellent Verified Leading for Design
Verified Leading for As Built

NorthLink WA Central Section

1.2  Design  Excellent Leading
NorthLink WA Northern Section 1.2  Design  Excellent Leading
Mitchell Freeway
Mitchell Freeway Extension 1.0 As Built Commended As Built
Rating Abandoned
Metropolitan Roads Improvement Alliance
Armadale Road 1.2 Design Excellent Excellent
Murdoch Activity Centre 1.2 Design Excellent Excellent
Wanneroo Road Duplication 1.2 Design Excellent Excellent
Armadale Road
Armadale Road
Northlake Road Bridge
2.0 Design Silver Silver
Bunbury Outer Ring Road
Bunbury Outer Ring Road 2.0 Planning Bronze Bronze

The following table provides information on projects valued between $20 and $100 million and subject to internal self-assessment using the IS rating tool and current status.

Project IS Version Current Phase Target Tracking Status
Swan River Pedestrian Bridge - Matagarup Bridge 1.0 As Built Commended Commended, Complete
New Lord Street 1.2 As Built Commended Commended
Nicholson Road Bridge Over Rail 1.2 As Built Commended Commended, Complete
Great Northern Highway - Wyndham Spur to Maggie's Jump Up 1.2 As Built Commended Excellent, Complete
SMART Freeways 1.2 Design Excellent Behind
Marble Bar Road - Coongan Gorge Realignmnent 1.2 As Built Excellent Behind
Mitchell Freeway Southbound Widening 1.2 Design Excellent Behind
Kwinana Freeway Widening Northbound 1.2 Design Excellent Excellent
Wanneroo / Joondalup Interchange Project 2.0 Design Silver Silver

Emissions and Energy

Developing, operating and using a road network consumes energy and generates emissions in numerous forms including carbon emissions, noise, vibration and other air pollution such as carbon monoxide, nitrogen dioxide, and particles. The predominant impacts from energy and emissions fall outside our direct control and arise from use of the road network itself. Urban air pollution is a known carcinogen and has a range of human impacts. Globally air pollution contributes to more deaths than road accidents. Of all the pollutants assessed, PM2.5 (tiny particles of matter, one‑fortieth the width of a hair) is considered to present the greatest potential impact to our health. No level of air pollution is completely safe for humans. Motor vehicles are a significant contributor to emissions, contributing 14 per cent of PM2.5, and 62 per cent of nitrogen oxides. 

Road transport makes up 15 per cent of Australia’s total emissions and has been the highest growing source of emissions since 1990. We estimate that the road network generates carbon emissions at a rate of 288.7 t CO2-e per million vehicle kilometres travelled (MKVT). In 2018–19, MKVT was 27,401 and thus emissions were approximately 7.9 mt CO2-e from use of the road network.

Our current approach has focused on reducing our direct energy use and emissions generation but we are aware of our ability to influence outcomes from our contracts and from the road network use. 

For example, travel times have improved in locations across the network including by up to two minutes along Marmion Avenue during peak periods. Reducing delays and stop-start traffic has a positive effect on carbon emissions from the road network. 

Noise and vibration is produced and influenced by the road network in a number of ways including from vehicles, infrastructure and road design, construction and maintenance activities. Installation of noise walls is an example of a mitigating activity.

Carbon Reduction Plan

We have a Carbon Reduction Plan and Target, 5 to 15 per cent reduction on 2010 levels by 2020, focused on Scope One and Two emissions and have had a Climate Change Adaptation Plan since 2011. Our total emissions across our facilities over the past year were 25,110 CO2-e, achieving our target which was to be below 27,925 CO2-e.

In December 2017, the State Government signed a Memorandum of Understanding (MOU) for Sub-National Collaboration on Electric Vehicles (EVs). 
The MOU is an output of the Climate Action Roundtable. Together with Western Power, we were nominated joint lead to ‘Take a coordinated approach to the strategic planning and construction of infrastructure for EVs’. In response, we commissioned UWA to undertake research into the need for State-wide EV Charging Infrastructure in WA. The report has been finalised and it is intended to be tabled in Parliament.

Emissions Metrics

Scope 1 or 2 and 3
GHG Type (t CO2) 2017 2018 2019
Fuel* 2,860 3,088 3,150
Street and traffic lights 16,804 18,614 23,497
Buildings 4,230 4,183 3,834
Air travel* 271 331 527
Projects and maintenance fuel use* 8,010 27,661 40,686
Waste* 8,391 10,2241 19,317
Offsets -1,183 0 -2,749
Total 44,472 53,877 88,262

* Note: Air-travel, project and maintenance fuel usage and waste are Scope 3 emissions

Scope 1 or 2 and 3
GHG Type (t CO2) 2017 2018 2019
Scope 1 3,046 3,296 3,347
Scope 2 20,848 24,578 24,578
Sub Total 23,848 27,925 27,925
Offsets -1,183 -2,749 -2,749
Total 22,711 25,886 25,176
Scope 3 19,772 38,232 60,530


Energy Use by Source
Energy Source 2017 2018 2019
Electricity usage (Mj) (within) 105,404  116,622  126,677 
Fuel and gas usage (Mj) (within)  45,095  47,353  49,387 
Projects and maintenance (outside) 290,651 374,828 548,371


Intensity Indicators
  2017 2018 2019
Mj per km State Road 8,101 8,850 9,480
Scope 1 & 2 t CO2 per km State Road 1.29 1.40 1.50

Climate Change Adaptation

We have identified more than 50 kilometres of State Roads that have been assessed to warrant earlier, more detailed evaluation for the impacts of climate change. The indicative replacement value of this at-risk infrastructure is in the order of $165 million. A fundamental aspect of our Sustainability Policy is climate change. Our Key Aspect Management Plan for Climate Change includes a progressive approach to embedding adaptation practice into standards and asset management practices. An important activity was embedding resilience into our asset management framework.

Materials for Road Building

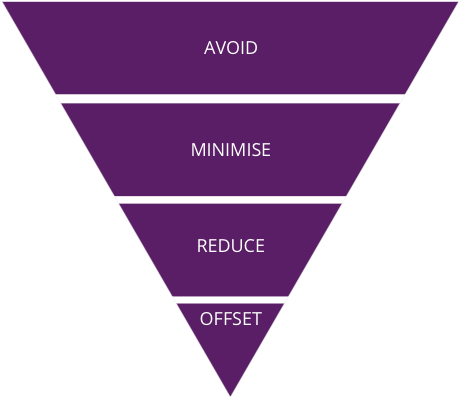
Natural materials are crucial in road building. Our philosophy on materials use is to minimise lifecycle impacts, including embodied energy, and to follow the hierarchy of reduce, re-use where possible, and recycle materials to their highest end-use possible. When obtaining road-building materials, we endeavour to avoid clearing natural vegetation. On-site materials unsuitable for use in road construction are used, as appropriate, for rehabilitating areas where road-building materials were obtained.

We also seek to incorporate recycled content into the significant materials used for road construction. Recycled content includes crumbed rubber, glass, asphalt and concrete. We have intent to contribute to developing the circular economy in WA.

Crush Recycled Concrete (CRC) is a road building material making up 50 per cent of Western Australia’s waste stream. We recognise our role in establishing an ongoing practice for the use of this material. A key project has been a collaboration with the Department of Water and Environmental Regulation (DWER), the Waste Authority and Industry to pilot the Roads to Reuse Program. A new product specification, that enables CRC to be used as road sub-base, has been released by DWER to manage the risk of contaminates including asbestos. Two infrastructure projects, Kwinana Freeway Northbound Widening and the Murdoch Drive Connection have been identified to use up to 25,000 tonnes of CRC under the product specification in 2019-20. Under the Waste Strategy 2030, we have committed to increasing our use of CRC to 100,000 tonnes.

Waste tyres are another significant challenge of the Waste Strategy 2030. We currently utilise crumbed rubber in resealing works, which could potentially be sourced using recycled tyres. We have committed to develop and implement alternative crumbed scrap rubber bituminous binders to double our and local government’s usage to over 1,200 tonnes per year.

Imported Road Construction Materials

Indicator (t) 2017
(000)
2018
(000)
2019
(000)
Sand 768.7  5,722.9  2,678 
Gravel 1,244.4  1236.7  2,037.9 
Crushed rock 404.3  684.5  825.7 
Limestone  462.2  814.4  520.9 
Aggregate 83.8  172.6  45.2 
Asphalt  202.5  403.9  422.7 
Bitumen  781.5  1284.4  40.8 
Bitumen Cutter  85.9  223  36.6 
Emulsion  120.2  789.2  27.0 
Concrete and steel  244.9  152.2  56.0 
Concrete  32.0 
Cement stabilised backfill 12.0 
Mulch  12.0 
Other (steel, paint, glass, primer, topsoil)  2.6  67.5  19.0 

Imported Recycled Construction Materials

Indicator (t) 2017
(000)
2018
(000)
2019
(000)
Sand 4.8 99.6 
Road base 0 33.9 66.3
Asphalt / profiling 6 2.1 14.4
14.4Crushed glass 0 17.1 7.4
Rehabilitation purposes - unsuitable material 4.2 7 88.5
Other (crumbed rubber, limestone, plastic, concrete, steel, topsoil, mulch) 0.1 0.6 0.8
Imported construction materials with an eco label 0 6 1.5

Waste Materials to Landfill (Waste)

Indicator (t) 2017
(000)
2018
(000)
2019
(000)
Kerbing / concrete 0..6 0.02  2.4 
Existing seal 0.05 3.0 2.5
Unsuitable material 5 39 77
Site office / general waste - 0.04 2.2
Other (roadside litter / waste, plastics) 0.4 0.1 0.02

Materials Recycled

Indicator (t) 2017
(000)
2018
(000)
2019
(000)
Sand 0.6 73.7  162.2 
Road base 0.0 3.6 46.8
Asphalt / profiling 6.2 24.8 17.0
Steel 0.9 0.6 0.24
Concrete 6.7 0.3 12.6
Office waste, general, roadside litter 3.0 1.6 0.7
Timber   0.2 0.9
Rock - - 89.4
Other (green waste, plastic, topsoil, hydrocarbons) 0.0 0.0 0.5

Waste Management: Roadsides, Buildings and Facilities

Controlling roadside waste across the State’s road network requires ever-increasing attention. We collaborate with key stakeholders, interested parties and community groups for a consistent litter management approach taking into account individual regional requirements. We continue to implement our State-Wide Litter Plan developed with the primary objectives of educating road users to take their litter with them and to reduce littering and illegal dumping. Implementing the plan involves boosting public awareness as well as increasing community buy-in and participation in litter reduction programs and behaviours.

Our commitment to improved waste management practices is evident in the design, construction, operation and ongoing management of our offices and depots. These incorporate waste management principles in design and construction, achieving five-star Green Star and NABERS ratings. Our offices have waste avoidance strategies and our depots have waste management plans for materials such as asbestos, concrete, steel, aluminium, batteries and waste oil. The separation of general office waste and recyclables is encouraged by providing paper, battery and printer cartridge recycling facilities.

We are reducing single-use plastics in the Don Aitken Centre by using alternative bin liners, replacing disposable cups with a biodegradable paper product and completely removing plastic cups from several building levels.

Sustainability Our Stories Page 72
Read the story

SUSTAINABILITY

Commitment to Infrastructure Sustainability Recognised

Winning the 2018 Organisational Leadership in Infrastructure Sustainability Award once again shows our contribution and commitment to sustainability. The award, from the Infrastructure Sustainability Council of Australia...