Our Finances

Download this section (4.3 MB)

Our financial summary shows key elements of our performance, with further detailed information in Financial Statements and Notes.

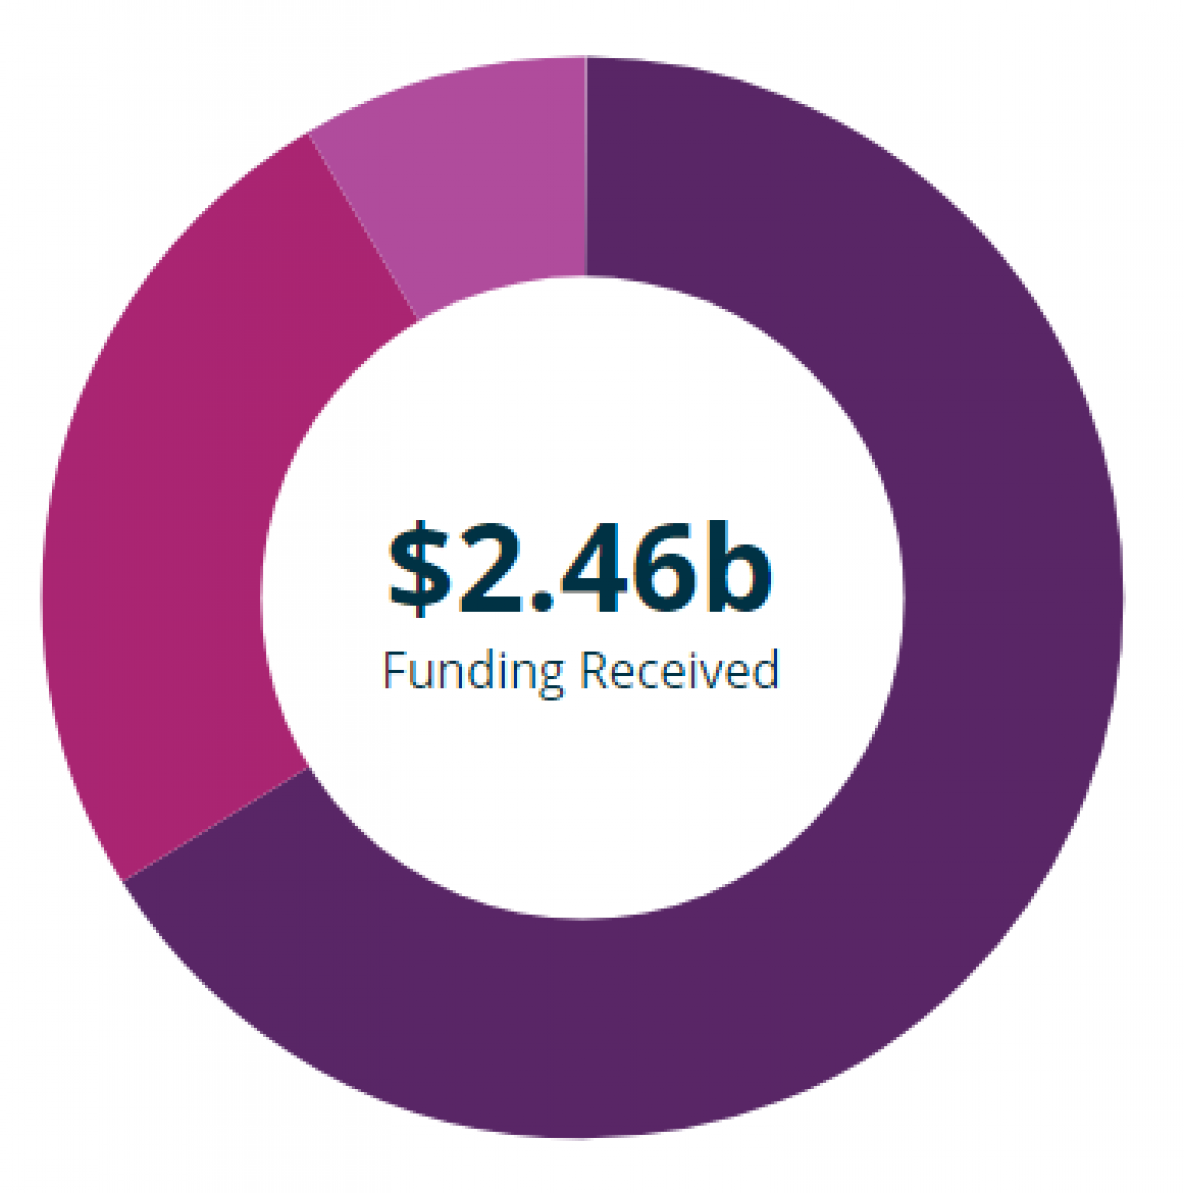
This year Main Roads received $2.46 billion in funding and invested more than $2.57 billion in managing the state road network.


Our Finances State Commonwealth Other

$2.46B
Funding Received

State

Commonwealth

Other

FUNDING SOURCES 2018-19

State - $1.63 billion
Commonwealth - $623 million
Other - $212 million

Graph showing Our Finances
Funding Sources ($ million) 2017 2018 2019
State 1,416 1,575 1,630
Commonwealth 263 772 623
Other 139 145 212
Total Funding Received 1,820 2,490 2,465

The largest contribution to our income is from the State Government with just over $1.63 billion or 66% of total funds received. At 25%, our second highest contribution comes from the Commonwealth Government valued at more than $623 million. These funds assist national and regional economic and social development by improving the performance of land transport infrastructure and include the National Black Spot Program and other local and national road projects. Other income sources include the Road Trauma Trust, Regional Royalties Program and funds for natural disasters to reinstate and re-open road infrastructure damaged by natural disasters.

Expenditure

During the year we spent funds of $2.57 billion delivering services across the state.

Expenditure by Service

The following shows the allocation of these funds aligned against our six – outcome based Services. Further information on each of the services the projects delivered, our performance and achievements are included in the Operational Performance section.

Expenditure by Service Road Safety Road Management Road Efficiency Maintenance State Development

$1.81B
Expenditure by Service

Road Safety

Road Management

Road Efficiency

Community Access

Maintenance

State Development

Road Safety - 9%
Road Management - 7%
Road Efficiency - 22%
Community Access - 3%
Maintenance - 25%
State Development - 34%

 EXPENDITURE BY SERVICE ($ billion) 2017 2018 2019
Road Safety 283 163 159
Road Management 125 136 128
Road Efficiency 358 330 411
Community Access 48 137 52
Road Maintenance 399 491 449
State Development 360 467 619
Total 1,573 1,724 1,818

Expenditure by Type

As you might expect, capital works represent our largest expenditure. This is followed by supplies and services associated with asset management, network operations and of course maintenance of our road network. In addition, due to the size of our asset base, we have a significant amount of depreciation. The next biggest area of expenditure is associated with grants and subsidies primarily to local government assisting with the maintenance and improvement of the local road network.

Expenditure by Type Employee benefits and superannuation Depreciation expense and amortisation Grants and subsidies Other expenses Capital expenditure

$2.57B
Expenditure by Type

Employee benefits and superannuation

Supplies and services

Depreciation expense and amortisation

Grants and subsidies

Other expenses

Capital expenditure

Employee benefits and superannuation - 2%
Supplies and services - 17%
Depreciation expense and amortisation - 15%
Grants and subsidies - 13%
Other expenses - 4%
Capital expenditure - 49%

EXPENDITURE BY TYPE ($ million) 2017 2018 2019
Employee benefits and superannuation 67.5 72 64.5
Supplies and services 472.7 519 431.3
Depreciation expense and amortisation 368.8 349 378.1
Grants and subsidies 275.9 271.1 332.6
Other expenses 143.5 46.1 93
Capital expenditure 951.6 1,065.2 1,271.2
Total expenditure 2,280.0 2,322.4 2,570.7

Our Assets

This year the total value of our assets is $48.26 billion which is an increase of about $800 million when compared against last year. The major component of our assets is road infrastructure assets, making up 92% of what we own representing $44.39 billion. Following is a breakdown of the main categories of assets we managed on behalf of the community over the last three years.

Graph - Our Assets Roads and Principal Shared Paths Other assets

$48.26B
Total Assets

Roads and Principal Shared Paths

Land under roads

Bridges

Other infrastructure

Property and plant

Amounts receivable

Other assets

Roads and Principal Shared Paths - 30%
Land under roads - 48%
Bridges - 9%
Other infrastructure - 5%
Property and plant - 1%
Amounts receivable - 6%
Other assets - 1%

Our Assets ($ billion) 2017 2018 2019
Roads and Principal Shared Paths 13.9 14.3 14.5
Land under roads 23.8 23.6 23.2
Bridges 3.8 3.9 4.1
Other infrastructure 1.6 2.0 2.5
Property and plant 0.5 0.4 0.4
Amounts receivable 2.2 2.5 2.8
Other assets 0.4 0.7 0.7
Total Assets 46.3 47.4 48.2