Key Performance Measures
Introduction
Main Roads uses performance measurement to gain insight into, and make judgements about, the effectiveness and efficiency of its programs, processes and people. We measure our progress in meeting strategic goals and outcomes, gather and analyse performance data and then use that data to drive improvements and successfully measure the deployment of actions into outcomes.
Our performance measures support managerial decision making by providing useful information on how efficient and effective our core processes are, if improvements are necessary, identification of potential risks, determination of customer and stakeholder satisfaction, and if we are meeting our own and Government goals.
We have a well-established outcome based performance measurement framework that seeks to measure the organisation's success in terms of delivering on agreed Government goals and outcomes. Our performance measures are integrated with the monthly performance evaluation process undertaken by the Corporate Executive Leadership team.
Alignment with Government Goals
The Western Australian Government has identified the following goals that Main Roads will contribute to delivering. We will achieve the delivery of the Government goals through an outcome-based Program Management approach. There are seven programs that drive outcome-based decision making to achieve the agreed business outcomes. The following table shows the alignment of each Program against the Government's goals.
| Main Roads | Government | |
| Program | Outcome | Goal |
| Road Safety | A safe road environment |
Outcome-Based Service Delivery |
| Office of Road Safety |
Improved coordination and community awareness of road safety |
|
| Road Management |
Reliable and efficient movement of people and goods |
|
| Road Efficiency | ||
| State Development | Facilitate economic and regional development | State Building - Major Projects |
| Maintenance | A well maintained road network | Stronger focus on the Regions |
| Community Access |
Improved community access and roadside amenity |
Social and Environmental Responsibility |
Understanding Community Perception Measures
Four of the measures are derived from an annual Community Perceptions Survey that seeks to reflect the satisfaction levels of customers in both metropolitan and rural areas of the State. These results are used to ensure that Main Roads' projects and customer service initiatives are targeted at the areas of greatest need.
Through the use of an external research company, the data was collected by way of telephone interview using a structured questionnaire. The results are based upon a random sample of 1,150 people (250 persons in the metropolitan area and 900 persons in rural areas). When extending these results to estimate the percentage of satisfied Western Australians, the margin of error is approximately 2.9% at the 95% confidence level and is also weighted to reflect the actual population distribution based on ABS statistics. Please note that the structure of the survey questionnaire has changed in 2011-12, however, the questions used to derive the results for this indicator remain unchanged. As such, comparability with prior year results is not affected.
The four measures are Community Satisfaction with Main Roads, road safety, maintenance, and provision of cycleway and pedestrian facilities.
Structure
The following provides a summary of Main Roads' program outcomes and measures for each indicator showing the trend over time as well as providing a status report as to how the results for 2011-12 compared against the targets agreed with Government. The remainder of this chapter provides commentary on the efficiency and effectiveness indicators grouped around the seven outcome-based programs.
Summary of Key Performance Measures and Outcomes

| 2009 | 2010 | 2011 | 2012 Target | 2012 Actual | Status | Ref | |||
| Road Safety Program | |||||||||
| % Community Satisfaction of road safety | 97 | 96 | 95 | 90 | 92 |
|
110 | ||
| Black Spot location indicator | 12.1 | 11.7 | 11.2 | 11.0 | 10.7 |
|
110 | ||
| % of contracts completed on time | 46 | 59 | 61 | 90 | 67 |
|
110 | ||
| % of contracts completed on budget | 91 | 95 | 88 | 90 | 95 |
|
110 | ||
| Office of Road Safety Program | |||||||||
| % Effectiveness of road safety awareness campaigns | n/a | 84 | 79 | >50 | 60 |
|
111 | ||
| % of ORS Projects completed on time | n/a | 78 | 90 | 90 | 87 |
|
111 | ||
| % of ORS Projects completed on budget | n/a | 82 | 88 | 90 | 97 |
|
111 | ||
| Road Efficiency and Road System Management Programs | |||||||||
| % Community Satisfaction | 97 | 97 | 97 | 90 | 95 |
|
112 | ||
| % Road network permitted for use by heavy vehicles | B Double-27.5m | 99 | 99 | 96 | 98 | 96 |
|
112 | |
| Double RT-27.5m | 98 | 98 | 96 | 98 | 96 |
|
112 | ||
| Double RT-36.5m | 80 | 79 | 78 | 79 | 78 |
|
112 | ||
| Triple RT-53.5m | 44 | 44 | 44 | 44 | 44 |
|
112 | ||
| % Network configuration | Roads | 88 | 89 | 89 | 90 | 89 |
|
112 | |
| Bridges | Strength | 94 | 95 | 95 | 95 | 95 |
|
113 | |
| Width | 94 | 94 | 94 | 94 | 95 |
|
113 | ||
| % of contracts completed on time | 36 | 44 | 57 | 90 | 55 |
|
113 | ||
| % of contracts completed on budget | 86 | 89 | 86 | 90 | 82 |
|
113 | ||
| Average $ cost of network management per million vehicle km travelled | 3,827 | 4,300 | 3,840 | 3,509 | 3,853 |
|
113 | ||
| State Development Program | |||||||||
| Average return on construction expenditure | 4.1 | 2.0 | 2.7 | 2.0 | 2.1 |
|
114 | ||
| % of contracts completed on time | 60 | 40 | 71 | 90 | 33 |
|
114 | ||
| % of contracts completed on budget | 80 | 100 | 100 | 90 | 100 |
|
114 | ||
| Road Maintenance Program | |||||||||
| % Smooth Travel Exposure | 97 | 98 | 98 | 97 | n/a | - | 115 | ||
| % Community Satisfaction road maintenance | 94 | 93 | 94 | 90 | 90 |
|
115 | ||
| % Preventative maintenance indicator | 88 | 87 | 85 | 84 | 85 |
|
115 | ||
| % availability of traffic signals, road lighting and emergency phones | Traffic Signals | 99.1 | 99.1 | 99.1 | 99 | 99.4 |
|
115 | |
| Road Lighting | 99.4 | 99.4 | 97.4 | 99 | 96.1 |
|
115 | ||
| Emergency phones | 99.9 | 99.9 | 99.9 | 99 | 99.9 |
|
115 | ||
| Average $ cost of network maintenance per lane kilometre of road network | 6,170 | 6,811 | 6,083 | 6,700 | 7,946 |
|
115 | ||
| Community Access Program | |||||||||
| % of the year that 100% of the Main Roads' State road network is available | 65 | 95 | 85 | 70 | 89 |
|
116 | ||
| % Community satisfaction with cycleways and pedestrian facilities | 89 | 90 | 90 | 90 | 76 |
|
116 | ||
| % of contracts completed on time | 40 | 86 | 50 | 90 | 80 |
|
116 | ||
| % of contracts completed on budget | 100 | 71 | 100 | 90 | 100 |
|
116 | ||
Road Safety
Outcome: Providing a Safe Road Environment
This program seeks to reduce the State's road fatality rate to the lowest in Australia by minimising road factors contributing to road trauma and reducing the serious crash injury rate. We demonstrate this through the following measures.
Community Satisfaction with Road Safety
This indicator represents how satisfied the community is with Main Roads' overall performance in the area of road safety. The survey results show that Main Roads' high performance on road safety remains strong with 92% rating it as okay or better exceeding the target of 90%. The overall trend for this indicator is declining with the current result down by 3% compared to last year. However Main Roads performance continues to rate strongly across all areas.

Black Spot Location Indicator
This indicator measures the number of locations on the road network that meet State Black Spot criteria based on crash history. The measure uses a sliding window to determine whether the number of locations eligible for funding is increasing or decreasing, taking into account the amount of travel in the State and the annual Black Spot funding used to treat those locations. The results for the period 2008 to 2011 have been recast as new information has been made available by the Australian Bureau of Statistics that amends the vehicle kilometres travelled input. Including this revised information ensures that the results over time remain accurate and comparable. Taking into account the new data the four year trend continues to show a gradual decline in the number of eligible black spot locations over the past four years with the 2012 result being the lowest recorded since the implementation of the Black Spot program in 2001, coming in below the estimated target.

Percentage of Contracts Completed on Time
This indicator represents the percentage of contracts that were delivered on time in the Road Safety Program. Whilst the target was established at 90%, 67% of contracts were delivered on time. Of the 14 contracts that were late, 12 exceeded the target date by more than 10 days. The following is an explanation of the reasons in each case:
- Two contracts were delayed due to poor contractor performance
- Six were delayed due to poor weather impacting on completion of works
- One contract was late due to unavailability of suitable natural materials
- Three were delayed due to service relocation by other bodies.
Percentage of Contracts Completed on Budget
This indicator represents the percentage of contracts delivered on budget in the Road Safety Program. The result of 82% is within an acceptable range of the target of 90%. There were two contracts that exceeded their target value; one was due to complications arising from unfavourable weather. The second case was due to lack of availability of suitable natural materials and minor scope changes associated with drainage.
Office of Road Safety
Outcome: Improved Coordination and Community Awareness of Road Safety
This program represents the outcomes sought from the Office of Road Safety and its role in supporting the Minister for Road Safety and the Road Safety Council in coordinating and raising community awareness of the road safety effort for Western Australia. We demonstrate this through the following measures.
* Note: Results from previous years are not available as this suite of measures was introduced for the first time in 2010.
Effectiveness of Road Safety Awareness Campaigns
This indicator represents the portion of Western Australian drivers who remember seeing major road safety community education campaigns (valued at more than $500,000) conducted by the Office of Road Safety. The data is collected independently through a professional market research company conducting campaign evaluation surveys of in excess of 400 responses before and after each major campaign, with a margin of error at plus or minus five per cent at the 95% confidence level. It should be noted that prior year information has been recast to reflect a more transparent approach aimed at ensuring that the benefit being measured is appropriate. This year the data is based on four major campaigns which averaged a penetration rate of 60%. This result whilst lower than last year exceeds the target of achieving an audience penetration rate of 50% or greater.
Percentage of Projects Completed on Time
This indicator represents the percentage of projects approved by the Road Safety Council and the Minister for Road Safety that were delivered on time by the Office of Road Safety, it excludes grant-funded projects. The current year's result shows that 87% of all projects were delivered on time slightly below the target of 90%.
Percentage of Contracts Completed on Budget
This indicator represents the percentage of projects approved by the Road Safety Council and the Minister for Road Safety that were delivered on budget by the Office of Road Safety. The current year's result shows that 97% of all projects were delivered on cost ahead of the target of 90%.
Efficiency and Road System Management
Outcome: Safe and Efficient Movement of People and Goods
The Efficiency Program seeks to improve the efficiency, capacity and utilisation of the existing road network whilst the Road System Management Program seeks to optimise real-time management of the network, provide traveller information, asset management planning, and support service delivery throughout the organisation. Together these programs contribute to achieving the outcome. We demonstrate this through the following measures.
Community Satisfaction
The Community Satisfaction Indicator represents how satisfied the community is with Main Roads' overall performance in the management and operation of the State road network. The results are drawn from the Community Perception Survey where respondents were asked to rate Main Roads' overall performance on a five-point scale, 95% of respondents rate Main Roads' performance as okay or better. The overall trend remains positive with very strong results over the past four years exceeding the established target.

Road Network Permitted for use by Heavy Freight Vehicles
This indicator relates to the efficient movement of goods within Western Australia and the percentage of available State roads accessed by B-Doubles, Double road trains and Triple road trains. The use of larger vehicles with greater payloads can increase the overall efficiency of freight transport operations, resulting in lower transport costs. However, to maintain road safety and guard against infrastructure damage, restrictions are placed on some trucks. Because of the relatively high efficiency of these vehicles, the proportion of roads accessible to them is an important factor in the overall efficiency of freight transport in this State. Over the past four years the trend has remained relatively consistent with most minor fluctuations in results attributed to changes in ownership of roads between State and Local Government and very minor variations with access categorisation.
Network Configuration - Roads
This indicator shows the percentage of travel undertaken on roads meeting specific criteria for seal width, carriageway width and curve rating. The indicator gives a measure of the ability of Main Roads to plan for and maintain roads to desirable standards. In 2012, 89.3% of travel was undertaken on roads meeting the seal width, carriageway width and curve rating criteria which was very close to the target of 90%. The four-year trend shows the network is improving and Main Roads continues to plan and program works to address roads that are below the criteria.

Network Configuration - Bridges
Similar to the roads measure, bridges are assessed for strength and width using agreed investigatory criteria. The monitoring of bridge strength and width needs to ensure a safe and efficient road network relating to improved access and transport efficiencies. These measures are indicators for the number of bridges on main roads and highways. Therefore, the percentage of bridges meeting these network configuration criteria should continue to rise but only slightly in future years. All bridges that do not meet the investigatory criteria for strength or width are considered in assessing, scoping and prioritising works, as part of the 10-year bridge strategy. The results of this indicator show that 95% of the bridges meet the agreed criteria for strength against a target of 95%. In relation to width, 95% of bridges meet the criteria against a target of 94%.
Percentage of Contracts Completed on Time
This indicator represents the percentage of contracts that were delivered on time in the Road Efficiency Program. Whilst the target was established at 90%, 55% of contracts were delivered on time. Of the five contracts that were late, only three exceeded the target date by more than 10 days. The following is an explanation of the reasons in each case:
- Two contracts were delayed due to poor contractor performance. In one case the sub-contractor is no longer eligible to tender for Main Roads works. The second instance resulted in reduced payments due to remedial works being carried out by the Principal.
- One contract was late due to delays in service relocations.
Percentage of Contracts Completed on Budget
This indicator represents the percentage of contracts delivered on budget in the Road Efficiency Program. The result of 82% is within an acceptable range of the target of 90%. There were two contracts that exceeded their target value: one was due to complications arising from unfavourable weather; the second was due to lack of availability of suitable natural materials and minor scope changes associated with drainage.
Average Cost of Network Management
This indicator measures the financial efficiency of the Road System Management program in terms of cost per million vehicle kilometres travelled to manage the road system. This measure has been calculated for the current and preceding three financial years in 2011-12 dollars. The overall four-year trend is inconsistent as this program includes occasional one-off development costs that can affect the overall results. In respect of the current year, the result of $3,853 per million vehicle kilometres travelled (mvkt) exceeds the target. The target was established using an estimate of mvkt. Now that the actual figures are available it is apparent that the estimate used to establish the target was overstated.
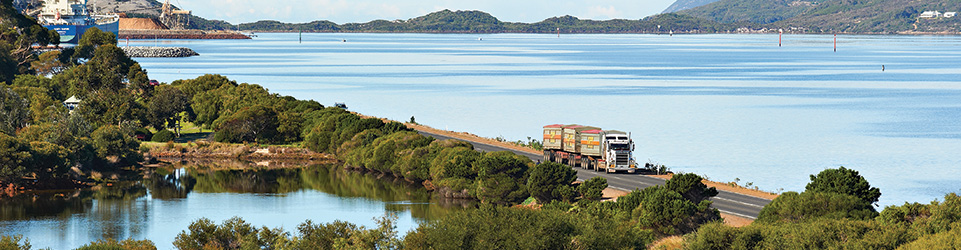
Princess Royal Drive, Albany
State Development
Outcome: Facilitating Economic and Regional Development
This program expands the road network in accordance with State and Commonwealth transport and land use strategies that will facilitate the economic and regional development of the State. We demonstrate this through the following measures.
Return on Construction Expenditure
New road and bridge construction networks add to the capacity of the road network. Return on Construction Expenditure is based on Benefit Cost Ratio (BCR) estimates of a set of projects undertaken each year. It indicates the extent to which road and bridge construction expenditure will deliver economic benefits to the community. This indicator represents the expenditure weighted BCR for the State Development Program for which a BCR has been calculated. The indicator has decreased from 4.1 in 2008-09 to 2.12 in 2011-12 due to the winding down of the New Perth Bunbury Highway Project. Given the large value and high BCR for this project, it has had a significant impact on the overall trend of this indicator. However, the outcome for the current year is slightly above the target.

Percentage of Contracts Completed on Time
This indicator represents the percentage of contracts that were delivered on time in the State Development Program. Whilst the target was established at 90%, 33% of contracts were delivered on time. This year the indicator is only measuring three contracts as many of the most significant projects are not due for completion until next financial year. In total two contracts were late. In one instance the contract was subject to a minor delay pending confirmation of compliance of specialist technical welds against Australian Standards; actual works were completed on time. In the second case the works were delivered late due to delays in obtaining approval to work on Port Authority land.
Percentage of Contracts Completed on Budget
This indicator represents the percentage of contracts delivered on budget against a target of 90% in the State Development Program. The result achieved was 100% of contracts being delivered on budget.
Road Maintenance
Outcome: Providing a Well-Maintained Network
This program seeks to maintain the existing road and bridge network by maximising asset life and minimising whole-of-life costs. We demonstrate this through the following measures.
Smooth Travel Exposure
This indicator is based on the percentage of travel undertaken on the State road network meeting specific roughness criteria. Over the last four years the results have been relatively constant with between 97 and 98% of all travel undertaken on roads that meet the roughness standard. When looking at the overall trend, the figures indicate that the network consistently provides smooth travel for road users. A review has been undertaken as to the frequency of the data collection that underpins this indicator and a decision was made to only collect this data every two years. Therefore, no data collection to support this indicator was done during 2011-12 and there is no result to report.
Community Satisfaction of Road Maintenance
The Community Satisfaction of Road Maintenance indicator represents how satisfied the community is with Main Roads in the maintenance of the State road network. The results are drawn from the Community Perception Survey. Overall community satisfaction with road maintenance has remained relatively stable at 90% and meets the agreed target.
Preventative Maintenance Indicator
The Preventative Maintenance Indicator provides a measure of the proportion of sealed State road network which has a surfacing age younger than its optimal target age. The indicator provides a measure of proactive maintenance undertaken on the network on an annual basis. Sections of the network with a surfacing age younger than target age are classified as 'Good'. In 2012, the proportion of the network with a surfacing age considered 'Good' was 85% which is above the target value of 84%. The results over the four-year period are relatively consistent.

Availability of Traffic Signals, Road Lighting and Emergency Telephones
This measures the availability of traffic signals, road lighting and emergency telephones throughout the road network as a percentage of time the assets are fully operational. The availability of traffic signals, road lighting and emergency telephones continues to be relatively stable. The result for road lighting was 3% below the target of 99%, this is attributed to the continuing growth in road lighting with more than 12,000 new light poles added to the network over the last 12 months. On the whole, this measure shows that Main Roads is maintaining and operating traffic signals, road lighting and emergency telephones throughout the network at near optimum levels.
| % availability of | 2009 | 2010 | 2011 |
2012 Target |
2012 Actual |
| Traffic Signals | 99.1 | 99.1 | 99.1 | 99 | 99.4 |
| Road Lighting | 99.4 | 99.4 | 97.4 | 99 | 96.1 |
| Emergency phones | 99.9 | 99.9 | 99.9 | 99 | 99.9 |
Average Cost of Network Maintenance Per Lane Kilometre of Road Network
This indicator identifies the financial efficiency of road and roadside maintenance works by showing the cost per lane kilometre to maintain acceptable travel conditions on State roads. In determining the cost basis expenditure on structures, infrastructure depreciation, grants to local government and pavement replacement on Kwinana Freeway have been excluded. In order to compare 2010-11 figures with previous years all figures have been adjusted and reported in terms of current year's dollars which can influence the trend result. The overall trend for this measure is inconsistent with the current result indicating that the measure did not meet target by some $1,246. The reason for this is largely as a result of excessive unfunded expenditure arising from declared Natural Disasters, inclusion of the reseal backlog program projects and payment of rise and fall claims associated with the former term network contracts coupled with establishment costs associated with implementation of the Integrated Services Arrangements not forming part of the original target.
Community Access
Outcome: Improving Community Access and Roadside Amenity
This program seeks to provide infrastructure that will increase personal mobility and community access. We demonstrate this through the following measures:
Unplanned Road Closure on the State Road Network
Generally 100% of Main Roads' road network is available to all road users; however, there are unplanned road closures due to a number of reasons including flooding, cyclones, major bushfires and major road accidents, which may vary in duration. The availability of the sealed road network is measured as a percentage of calendar days that the whole network is available to the road user. Closure is determined by measuring the number of whole days (24 hours commencing from the time the road is closed) that any section of the sealed road network is closed. This year the road network was available 89% of the year which exceeds the 70% target. With the exception of bushfire events in the Mid West and Gascoyne, all other closures were due to flooding and rainfall events including Tropical Cyclone Lua.
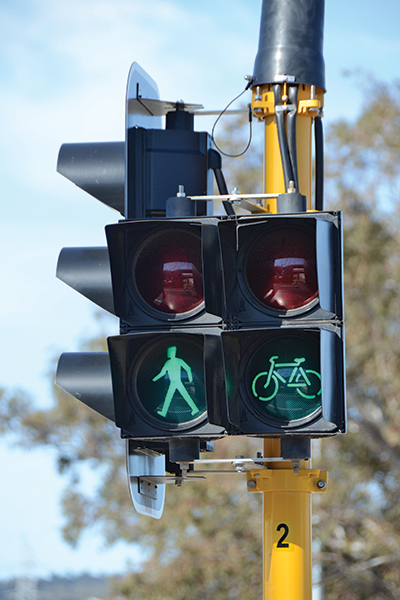
Community Satisfaction with Cycleways and Pedestrian Facilities
This indicator represents how satisfied the community is with Main Roads' performance in the construction, maintenance and management of cycleways and pedestrian facilities. The results are drawn from the Community Perception Survey. The overall result shows that community satisfaction regarding provision of cycleway and pedestrian facilities has fallen significantly to 76% and is well below the target of 90%. The 24% who rated Main Roads as poor or terrible were asked to provide a reason for their rating, common themes that emerged included limited pedestrian facilities on major roads, not enough places for pedestrians to safely cross roads, and a view that bicycle riders need to have their own cycle lanes.
Percentage of Contracts Completed on Time
This indicator represents the percentage of contracts that were delivered on time in the Community Access Program. Whilst the target was established at 90%, 80% of contracts were delivered on time. Only one contract was late which was due to defective works, rework was undertaken at the contractors own cost.
Percentage of Contracts Completed on Budget
This indicator represents the percentage of contracts delivered on budget against a target of 90%. The result achieved was 100% of contracts being delivered on budget.