OUR FINANCIAL SUMMARY
KEY HIGHLIGHTS
- $1.5 billion of Services Delivered
- $67.3 million Increase in the Value of Infrastructure Assets
- $565 million Invested in Capital Works
Our Financial Summary seeks to provide a view on some key elements of our financial statements. The information is intended to complement our full financial statements for 201112 which are available at pages 117 to 158.
INCOME
We received a total income of $1.6 billion in 2011-12. A breakdown of categories is shown below:
Income Sources ($ million)
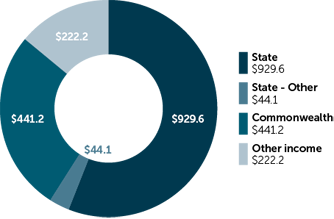
The largest contribution to our income represents appropriations from the State Government totalling just over $929 million or 57% of total funds received. At 27%, our second highest contribution comes from the Commonwealth Government valued at more than $441 million. These funds assist national and regional economic and social development by improving the performance of land transport infrastructure and include the national Black Spot program and other local and national road projects.
Other income sources include collections from fines allocated to the Road Trauma Trust Account totalling almost $58 million and funds from the Fire and Emergency Services Authority to reinstate and re-open road infrastructure damaged by natural disasters, which over the last 12 months amounted to $41 million.
OUR ASSETS
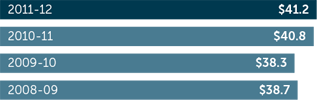
This year the total value of our assets is $41.2 billion which is an increase of about $400 million when compared against last year, due to a recent revaluation of assets and new capital works investments. The major component of our assets is road infrastructure assets, making up 94% of what we own representing $38.9 billion. This graph shows the changing trend in the value of the assets we manage on behalf of the community over the last four years.
Our Assets ($ billion)
OUR LIABILITIES
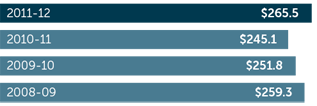
Our liabilities comprise of loans, employees' leave entitlements and other payables such as creditors, major contracts and services accruals and unsettled property acquisitions. This year the total value of our liabilities is $265.5 million representing a slight increase of just over $20 million from last year. This increase was due to the significant number of major contracts in progress where we recognise work completed but not physically paid. Below is the trend of our liabilities at the end of each financial year over the last four years.
Our Liabilities ($ million)
EXPENDITURE
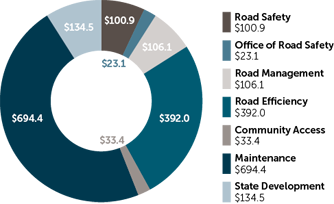
During the year we spent funds of $1.5 billion in delivering services
Expenditure by Program ($ million)
The following graph shows the allocation of these funds aligned against our seven-outcome based Programs. Further information on each of the Programs, the projects delivered, our performance and achievements are included in the Performance section.
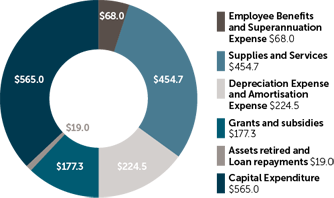
Expenditure by Type ($ million)
As you might expect our largest expenditure areas are capital works and supplies and services associated with asset management, network operations and of course maintenance of our road network. In addition due to the size of our asset base we also have a significant amount of depreciation. The next biggest area of expenditure is associated with grants and subsidies primarily to Local Government assisting with the maintenance and improvement of the local road network.