Our Performance ScoreCard
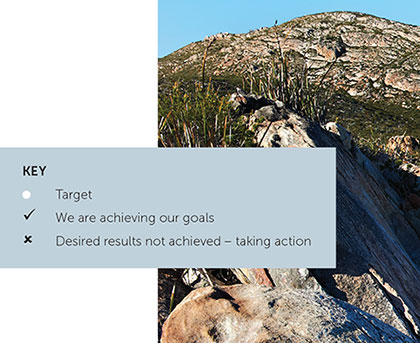
Key Performance Indicators are an integral part of managing outcomes in areas that have been identified as being critical to our business. The following is a summary of our success in delivering agreed Government outcomes. As the results show, for the vast majority of measures, we are achieving our goals with the exception of percentage of contracts completed on time. Some reasons for not achieving that target include unfavourable weather conditions, relocation of utilities, and changes in scope. Full explanations on all the measures can be found on the corresponding page reference for each indicator. In addition, there are a range of other relevant business measures incorporated within the contents of the report.
| Level of Achievement | Status | Ref | |||
| Road Safety | |||||
| % Community satisfaction of road safety | 
|
|
110 | ||
| Black spot location indicator |

|
|
110 | ||
| % of contracts completed on time |

|
|
110 | ||
| % of contracts completed on budget |

|
|
110 | ||
| Office of Road Safety | |||||
| % Effectiveness of road safety awareness campaigns |

|
|
111 | ||
| % of ORS Projects completed on time |

|
|
111 | ||
| % of ORS Projects completed on budget |

|
|
111 | ||
| Road Efficiency; Road Management | |||||
| % Community satisfaction |

|
|
112 | ||
|
% Road network permitted for use by heavy vehicles |
B Double 27.5m |

|
|
112 | |
| Double RT 27.5m |

|
|
112 | ||
| Double RT 36.5m |

|
|
112 | ||
| Triple RT 53.5m |

|
|
112 | ||
| % Network configuration | Roads |

|
|
112 | |
| Bridges | Strength |

|
|
113 | |
| Width |

|
|
113 | ||
| % of contracts completed on time |

|
|
113 | ||
| % of contracts completed on budget |

|
|
113 | ||
|
Average $ cost of network management per million vehicle km travelled |

|
|
113 | ||
| State Development | |||||
| Average return on construction expenditure |

|
|
114 | ||
| % of contracts completed on time |

|
|
114 | ||
| % of contracts completed on budget |

|
|
114 | ||
| Maintenance | |||||
| % Smooth travel exposure |

|
- | 115 | ||
| % Community satisfaction road maintenance |

|
|
115 | ||
| % Preventative maintenance indicator |

|
|
115 | ||
| % Availability of traffic signals, road lighting and emergency phones | Traffic signals |

|
|
115 | |
| Road lighting |

|
|
115 | ||
| Emergency phones |

|
|
115 | ||
|
Average $ cost of network maintenance per lane kilometre of road network |

|
|
115 | ||
| Community Access | |||||
| % of the year that 100% of the Main Roads' State road network is available |

|
|
116 | ||
| % Community satisfaction with cycleways and pedestrian facilities |

|
|
116 | ||
| % of contracts completed on time |

|
|
116 | ||
| % of contracts completed on budget |

|
|
116 | ||